Domo Charts
Use Domo to empower your teams with cutting-edge AI solutions designed for security, scalability, and trust. Reimagine what’s possible with your data.

chart
No items found.
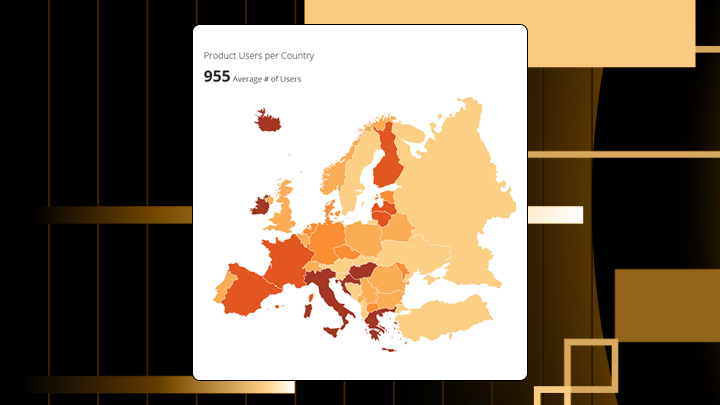
Map Chart Guide: When and How to Use Geographic Visuals
This is some text inside of a div block.
Data Visualization
Map Chart Guide: When and How to Use Geographic Visuals
map-charts-guide
chart
No items found.
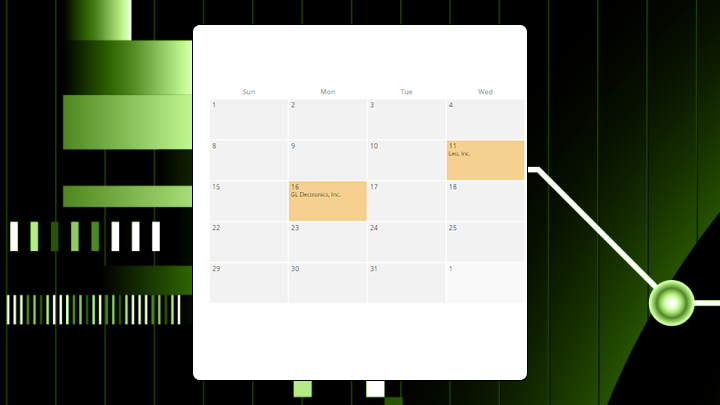
Calendar Chart: Definition, Examples, and Use Cases
This is some text inside of a div block.
Data Visualization
Trends Over Time
Calendar Chart: Definition, Examples, and Use Cases
calendar-chart

chart
No items found.
Grouped Bar Chart: Definition, Examples, and Best Practices
This is some text inside of a div block.
Data Visualization
Comparison
Grouped Bar Chart: Definition, Examples, and Best Practices
grouped-bar-chart

chart
No items found.
Venn Diagram Charts Explained: Types, Examples, and Uses
This is some text inside of a div block.
Data Visualization
Relationships & Correlations
Venn Diagram Chart Explained: Types, Examples, and Uses
venn-diagram-chart

chart
No items found.
OHLC Chart: Open-High-Low-Close Chart Overview
This is some text inside of a div block.
Data Visualization
Trends Over Time
OHLC Chart: Open-High-Low-Close Chart Overview Guide
ohlc-chart

chart
No items found.
Stem-and-Leaf Plot: What It Is and How to Create One
This is some text inside of a div block.
Data Visualization
Distribution & Statistics
Stem and Leaf Plot Chart: What It Is and How to Create One
stem-and-leaf-plot-chart

chart
No items found.
Step Line Chart: What It Is and When to Use It
This is some text inside of a div block.
Data Visualization
Trends Over Time
Step Line Chart: What It Is and When to Use It
step-line-chart

chart
No items found.
Dependency Gantt Chart: A Visual Guide for Project Teams
This is some text inside of a div block.
Project & Performance
Productivity
Dependency Gantt Chart: A Visual Guide for Project Teams
dependency-gantt-chart
chart
No items found.
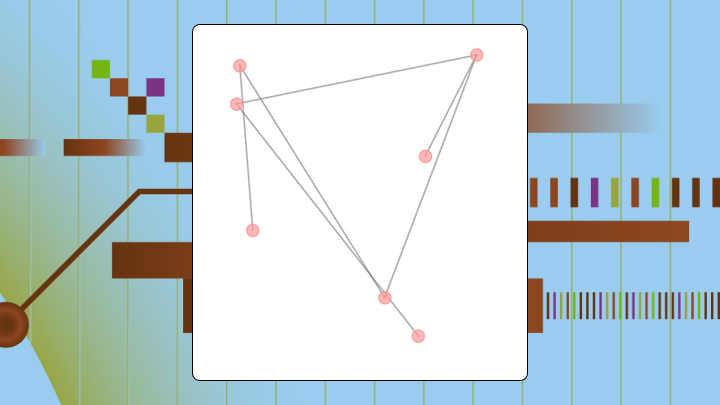
Connection Map: What It Is and When to Use One
This is some text inside of a div block.
Data Visualization
Geospatial & Maps
Connection Map: What It Is and When to Use One
connection-map
chart
No items found.
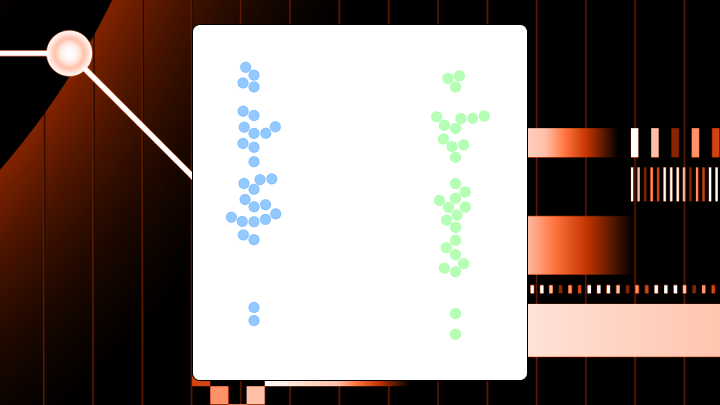
Beeswarm Plot Chart: Definition, Examples & Best Practices
This is some text inside of a div block.
Data Visualization
Distribution & Statistics
Beeswarm Plot Chart: Definition, Examples and Best Practices
beeswarm-plot-chart

We couldn’t find any content matching your search.
Try adjusting your search terms or reset your search to start over
Reset Search