Domo Charts
Use Domo to empower your teams with cutting-edge AI solutions designed for security, scalability, and trust. Reimagine what’s possible with your data.

chart
No items found.
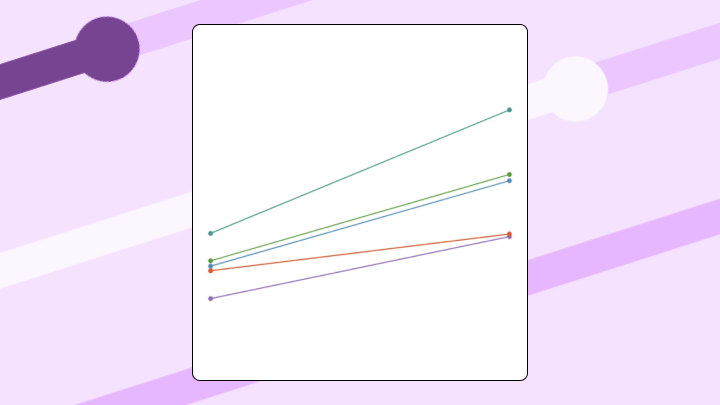
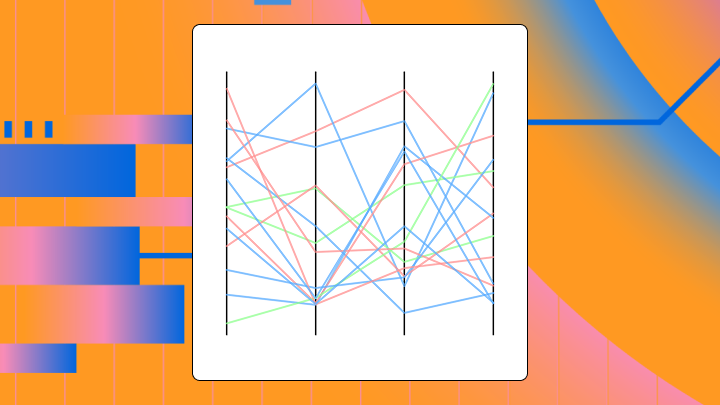
Slope Chart: What It Is and When To Use It
This is some text inside of a div block.
Data Visualization
Slope Chart: What It Is and When to Use It
slope-chart
chart
No items found.
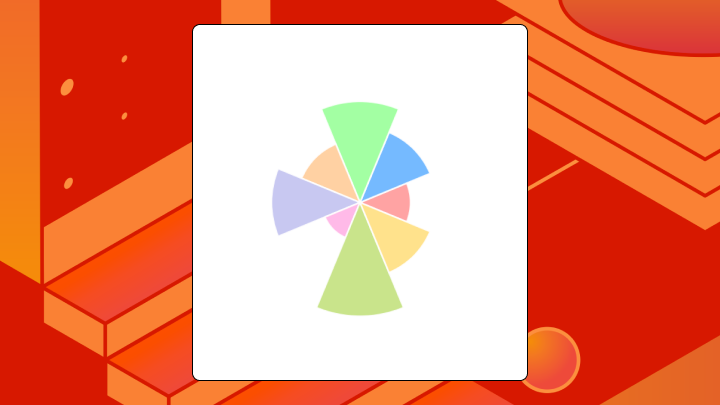
Nightingale Rose Chart: What It Is and When to Use It
This is some text inside of a div block.
Data Visualization
Nightingale Rose Chart: What It Is and When to Use It
nightingale-rose-chart
chart
No items found.
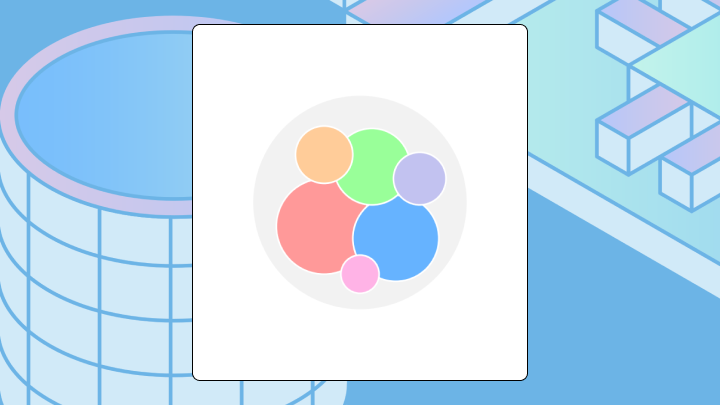
Circle Packing Chart: Definition, Examples, and Best Practices
This is some text inside of a div block.
Data Visualization
Circle Packing Chart: Definition, Examples, Best Practices
circle-packing-chart

chart
No items found.
Non-Ribbon Chord Diagram: Definition and Examples
This is some text inside of a div block.
Data Visualization
Non-Ribbon Chord Diagram: Definition and Examples
non-ribbon-chord-diagram

chart
No items found.
Horizontal Stacked Bar Chart: What It Is and When to Use It
This is some text inside of a div block.
Data Visualization
Horizontal Stacked Bar Chart: What It Is and When to Use
horizontal-stacked-bar
chart
No items found.
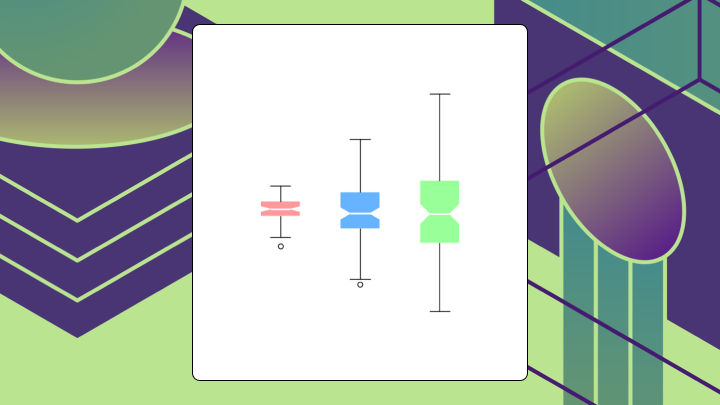
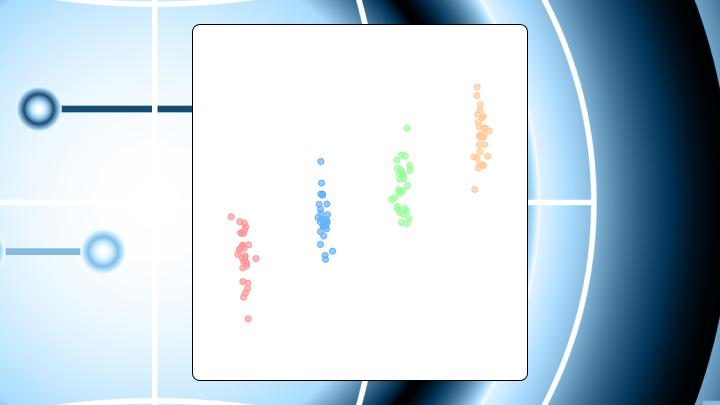
Notched Box Plot: What It Is and When to Use It
This is some text inside of a div block.
Data Visualization
Notched Box Plot: What It Is and When to Use It
notched-box-plot
chart
No items found.
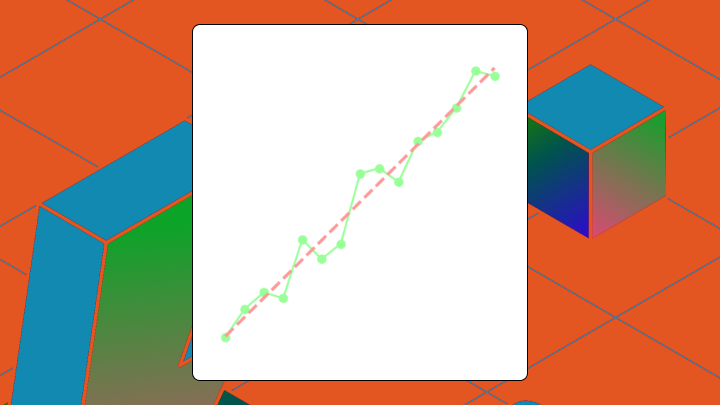
What is a Trendline Chart? A Complete Visual Guide
This is some text inside of a div block.
Data Visualization
What Is a Trendline Chart? Types, Uses, and Examples
trendline-chart
chart
No items found.
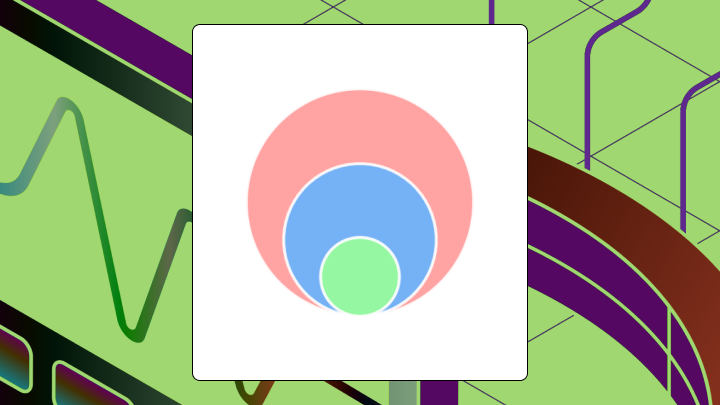
Proportional Area Chart: Definition, Examples, and Best Practices
This is some text inside of a div block.
Data Visualization
Proportional Area Chart: Definition and Best Practices
proportional-area-chart
chart
No items found.
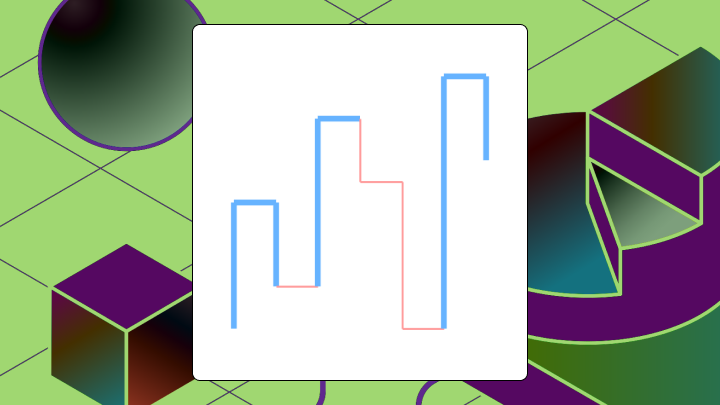
Kagi chart: Definition, Examples, and How It Works
This is some text inside of a div block.
Data Visualization
Kagi Chart: Definition, Examples, and How It Works
kagi-chart
chart
No items found.
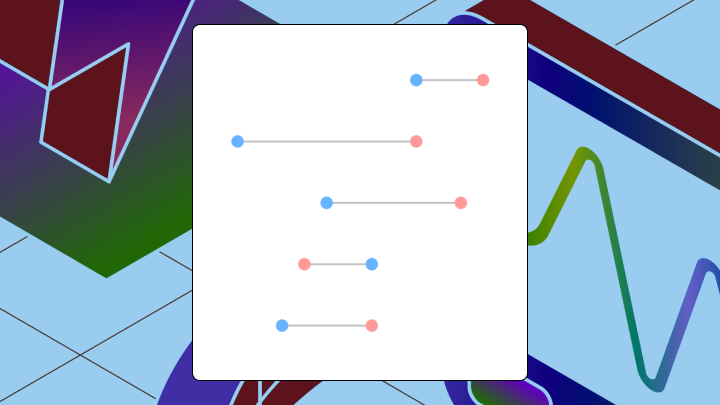
Cleveland Dot Plot: What It Is and When to Use It
This is some text inside of a div block.
Data Visualization
Cleveland Dot Plot: What It Is and When to Use It
cleveland-dot-plot
We couldn’t find any content matching your search.
Try adjusting your search terms or reset your search to start over
Reset Search