Join the AI + Data Tour for hands-on training, real customer stories, and time with Domo product experts near you.
Register now
Domo Analyzer is where you can analyze data using AI-powered tools to uncover patterns, compare metrics, and turn raw data into clear insights.
.webp)
Analyzer is a core Domo feature that helps teams explore data, compare metrics, and understand performance through interactive visualizations.
Analyzer makes it easy to create and refine interactive visualizations that fit your data and goals. Choose from a wide range of options, including:

Trellis charts for comparing multiple dimensions side by side

Data science charts for advanced analysis

Maps to visualize geographic trends

Period-over-period charts to track performance over time

Tables for detailed reporting and comparison
Want more flexibility? Build custom charts to match your business needs.
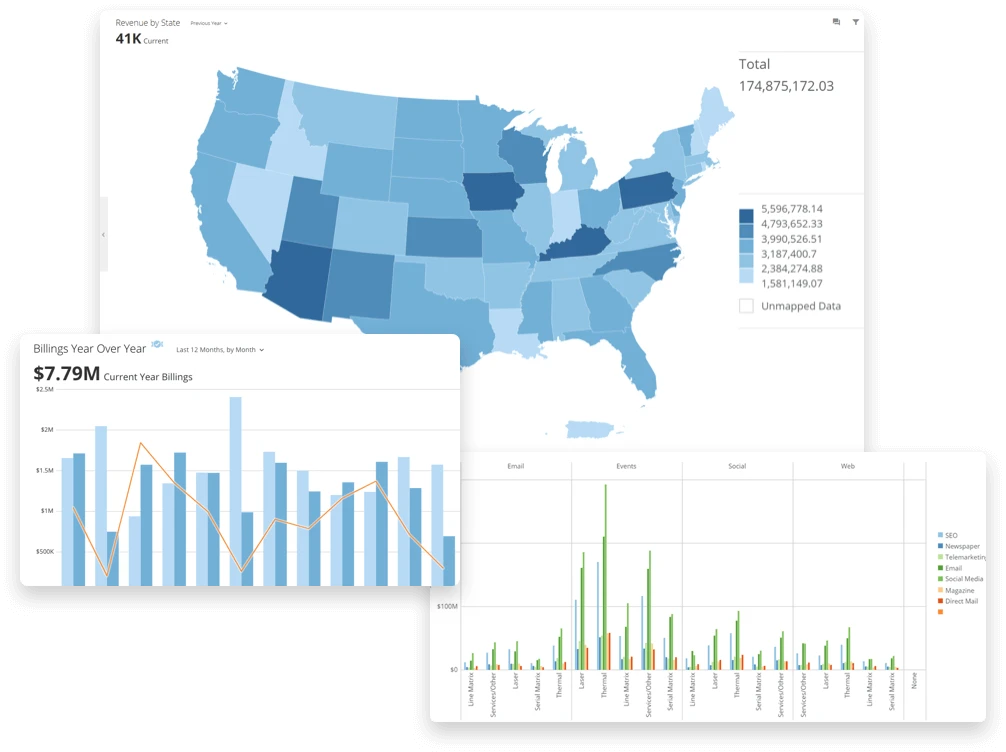


Analyzer gives you flexible ways to filter and explore data so you can uncover insights in seconds.


Quick filters let you analyze data instantly with predefined options.

Tooltips reveal extra details when you hover over charts.

Page-level filters apply one filter across every chart for consistency.

Data lineage shows each card’s source so you can trust your data.

Advanced filters refine results with options like 'contains' or 'starts with.'

Drill paths let viewers click any chart element to explore the data behind the number.
Domo Analyzer helps teams track KPIs in real time, monitor performance against targets, and spot changes early using interactive dashboards powered by AI-driven analysis.

Identify changes and patterns as you filter and explore data

Understand what’s driving KPI changes without rebuilding dashboards

Spend less time digging and more time interpreting results
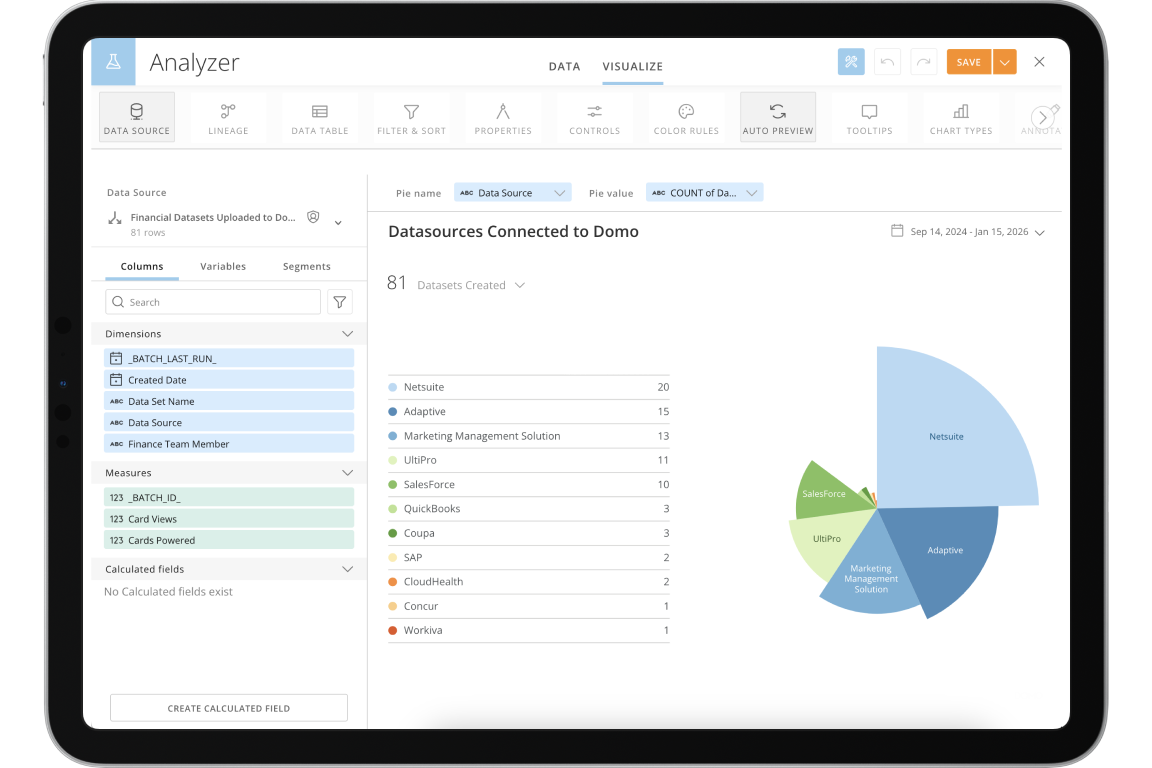
Domo Analyzer’s advanced features help teams identify patterns, outliers, and trends faster by adding clarity and context to their data.

Domo Analyzer helps teams track KPIs in real time, monitor performance against targets, and spot changes early using interactive dashboards powered by AI-driven analysis.


Use Domo Stories to design flexible, custom-branded dashboards with your own colors, filters, and charts. Build interactive visualizations that make complex data easy to explore for every user—no coding or IT help needed.

See how your data can drive faster, clearer decisions with Domo.