Domo Stories
Tell a story with your data.
Customizable dashboards, called Stories, help guide data analysis, so your data can tell the story you want it to tell.
Design it your way.
Customizable dashboard layouts put you in charge of how your information is received by others.
Deliver a consistent story.
With Domo Stories, your story is consistent no matter the device, whether it’s mobile, tablet, or computer.
Provide flexible views.
Set up your dashboard with interactive filters so individual users can drill down to the data and view they need to see.
Customize your layout.
You’re in charge of how your information is viewed with customizable dashboard layouts.
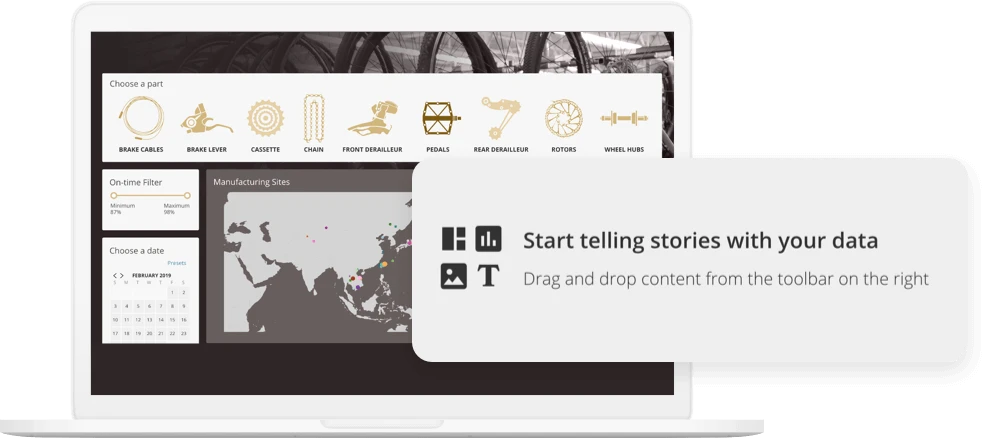
Help users know what to focus on by emphasizing specific metrics and how your data relates to other information.
Create the layout you want with drag and drop cards, headers, and templates, and use in-line notebook cards to deliver commentary about data on the same page.

32%

"Domo is a silver bullet in terms of creating insights out of data. It demystifies complex KPIs and enables us to unlock the power of multiple data sources to see a concise moment of truth."
Change the look and feel of cards.
Resize and reorder cards to make certain KPIs more prominent, change dashboard and card colors, and add background colors to imprint your brand on your dashboard.

Dynamically update and display data.
Communicate key takeaways with dynamic display options and tools:
You’re in charge of how your information is viewed with customizable dashboard layouts.
Help users know what to focus on by emphasizing specific metrics and how your data relates to other information.

Design once for all platforms.
When you design a dashboard with Stories, the format is automatically adapted to be mobile-compatible, so you deliver a consistent narrative whenever and wherever the dashboard is accessed. And all exports of your dashboard maintain the same layout.

32%

"When the metrics are telling us something is wrong or something is going well, we can identify and act on it very quickly. Our data is delivered to us in a very automated, easily consumable way."
Make your information interactive.
Use flexible filtering to make your data interactive and easy to explore:
Choose what filters you apply to certain cards, so you can have different filters on cards on the dashboard.
Link to other dashboards in Domo or external websites.
Drill down on cards right from the dashboard to keep dashboard context front and center.


Explore Domo’s BI & Analytics features.
BI & ANALYTICS FEATURES
Provide self-service data
Integrate data science
Putting your data to work
Explore the data experiences that trigger better, faster decisions across every team and function.
Visualizations & Dashboards
Create interactive, easy-to-use visualizations that support "Aha!" moments.
Reporting & Self-Service Analytics
Modernize your reporting with real-time data that everyone can self-serve.
Business Apps
Build low- or pro-code apps that improve operational processes.
Embedded Analytics
Securely share data and insights outside your organization.
Domo.AI
Deliver actionable data experiences that scale with an AI framework you can trust.