Nehmen Sie an der AI + Data Tour teil und profitieren Sie von praktischen Schulungen, echten Kundengeschichten und dem Austausch mit Domo-Produktexperten in Ihrer Nähe.
Jetzt registrieren

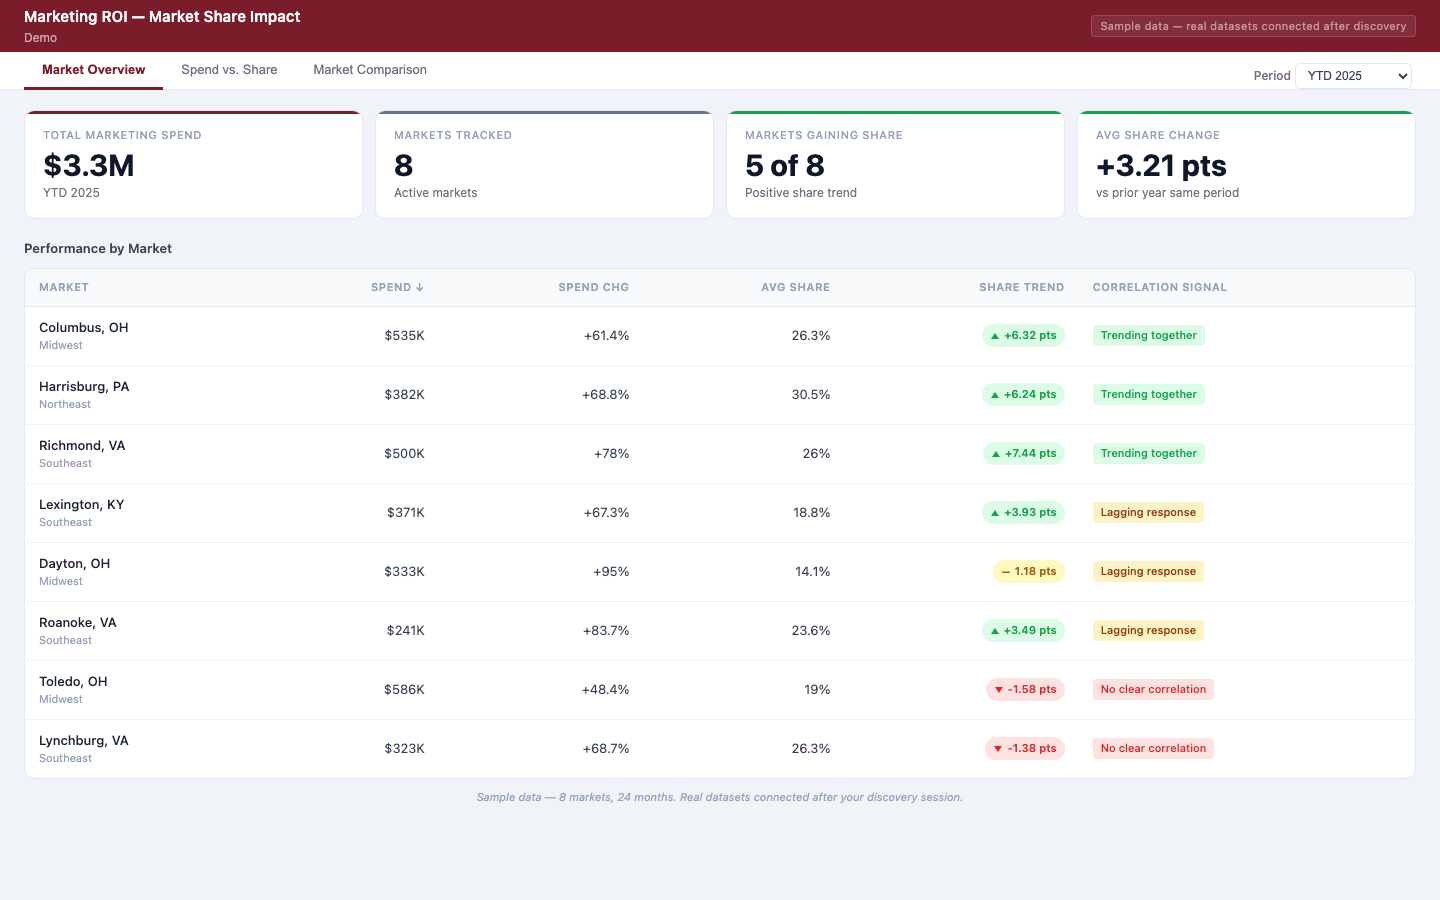
## The problemIn multi-location service businesses, marketing spend reporting and market share reporting live in two different dashboards. Leadership opens both and tries to estimate the relationship in their head — was that radio buy in one region actually moving the needle, or was the share gain coincidence? The next budget cycle arrives before anyone has answered the question with confidence.## What this app doesA single view that joins marketing spend and market share across every geography. Leadership sees, market by market, whether spend and share are moving together or diverging. A correlation insight label calls out the markets where the relationship is meaningful, in plain language. A period toggle flips between MTD, QTD, YTD, and prior-year-same-period without re-opening another report. Underperforming markets — high spend, flat share — get flagged for the next budget conversation.## Key takeaways- Spend and share unified in one tracker, not two dashboards- Per-market correlation labels in plain language- Period comparison toggle without losing context- Flagged markets surface high spend with flat share returns## Who it's forFinance, executive, and operations leaders at multi-location service businesses making geographic marketing budget decisions.