
Marketing Spend and Market Share Tracker by Geography
The problem
In multi-location service businesses, marketing spend reporting and market share reporting live in two different dashboards. Leadership opens both and tries to estimate the relationship in their head—was that radio buy in one region actually moving the needle, or was the share gain coincidence? The next budget cycle arrives before anyone has answered the question with confidence.
What this app does
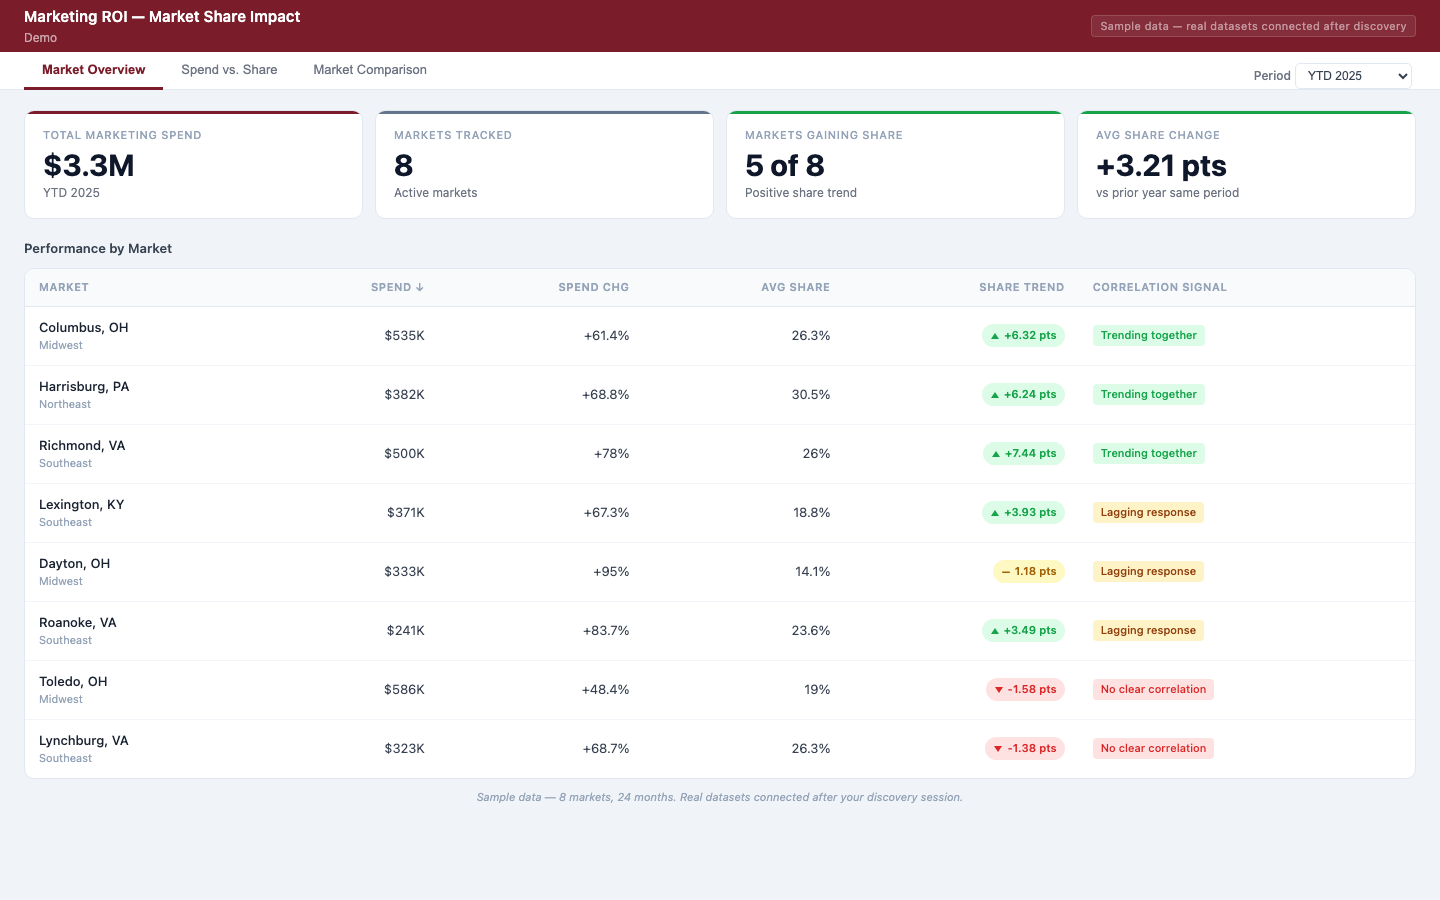
A single view that joins marketing spend and market share across every geography. Leadership sees, market by market, whether spend and share are moving together or diverging. A correlation insight label calls out the markets where the relationship is meaningful, in plain language. A period toggle flips between MTD, QTD, YTD, and prior-year-same-period without re-opening another report. Underperforming markets—high spend, flat share—get flagged for the next budget conversation.
Key takeaways
- Spend and share unified in one tracker, not two dashboards
- Per-market correlation labels in plain language
- Period comparison toggle without losing context
- Flagged markets surface high spend with flat share returns
Who it's for
Finance, executive, and operations leaders at multi-location service businesses making geographic marketing budget decisions.
Connect marketing spend to share movement
See how Domo can replace your toggling between spend and share dashboards with a single market-by-market view. Request a tailored marketing finance build.
{{custom-cta-1}}