Join the AI + Data Tour for hands-on training, real customer stories, and time with Domo product experts near you.
Register now

Mark: What's up, everybody? Good morning. I'm here with the man, the myth, the legend, Mr. Dan Wentworth, who is one of the managers of our solution engineering team. He builds really cool stuff for customers. Is that a fair explanation of what you do?
Dan: Yeah, I'd say so. We are always looking for ways to help customers. A lot of times, it's even just coming in and helping them understand the foundations. A lot of people are scared, or they hear terms like "agentic agents" or "agentic workflows," and they wonder, "How do I even think about those? How do I build those?"
So, it's about breaking down the different pieces, helping people understand the foundations, and not being scared of these things. Today, we're going to show something just like that—a really easy pattern to use to build an agent that can be incredibly effective for the business.
Mark: So Dan, you talk to a lot of customers and prospects. How many of them would you say that you get on the phone with and they already know, they've already figured it out, they get it, they know AI, and they know how to use it? How many?
Dan: I mean, it's not a ton. Most people say, "We know AI," and then they pull up ChatGPT, Gemini, or Claude, and they're asking questions and getting answers. To them, they think, "Oh, this is my agent. I can ask it things, and it can give me answers." But they haven't really set it up properly.
Usually, when you think about an agent, it works within a loop. It has a defined task, something repetitive that it can do over and over again, which you can schedule through orchestration. That's what makes Domo such an incredible platform to leverage and use agents. Most people have an idea and are leveraging AI, but probably not to the extent that they could to help the business.
Mark: That's fair. Okay. So, you built this really cool agent. We're going to look at it from a retail lens today, which, with Black Friday and Cyber Monday coming up shortly, is probably a good time. But this could span media, entertainment, travel, or anything, right?
Dan: Yeah, I think I chose retail intentionally for this example because this pattern becomes particularly interesting in businesses or segments where conditions change quickly.
As a CEO, CRO, or whatever, every morning I might have hundreds of stores, thousands of products, promotions running, inventory moving around, shipments arriving, traffic changing, conversion changing, returns coming in—so many different signals.
Traditional BI tells me, "We've built this dashboard, but it's around questions we already thought to ask." We already decided these are the things we want to look at: Is revenue going up? Are conversions going down? How are my shipments performing? How is the user experience for customers?
But there are so many signals. How can we leverage an agent in a way where it can look across the business, look across these signals, and surface questions we aren't even thinking about? In the end, one of our many fantastic analysts, or you yourself, would find those answers eventually.
Mark: Absolutely. Whether it's myself or an analyst on my team, someone is eventually going to find those things. But it might be hours, days, or weeks later.
Think about some sort of huge impact to your business, and you're finding out 24 hours later when you could have had that signal 12 hours ago and taken action. You could have had a huge impact on revenue for that day.
So, yes, people will find these things. This doesn't change the need for dashboards or conversational analytics, but it is going to surface those signals a lot faster. I love it. Okay, let's dig in. Where do you want to start?
Dan: Let's jump over. I'm going to show my screen here. I'm just going to share the entire screen. Do you see this AI Business Investigator, Mark?
Mark: Yep.
Dan: Perfect. So, again, there's just so much happening for anybody to manually investigate and think about every combination of those signals. There are obviously questions I know I'm going to ask every day, which we see at the top of the dashboard here.
Again, this is where I see a lot of people jumping into their chat experiences like ChatGPT, Gemini, Claude, and others, and asking these same questions. But that's something we can automate right off the bat.
"How did we perform yesterday?" Just looking at this first question: revenue was 8.14 million, 3.8% above plan. What's happening with traffic? We're up 5.2%. How is conversion? Slightly down a little bit. There is nothing revolutionary here; this is the kind of information we'd expect from a good executive dashboard.
So, I wanted to take it one step further. These are the questions the executive is going to ask every morning: Which regions are missing? Are any stores at immediate risk? How are promotions performing? Are returns increasing? Instead of making me find those answers, they're now waiting for me. I think this is where a lot of conversational analytics is headed. If I ask the same five questions every morning, why should I have to type them into a chatbot?
What I find a little bit more interesting now is that everything we've looked at here still represents questions we already knew to ask. The problem I want to solve is: what if I don't know something is wrong? What if I see something change, but I don't know which of the hundred metrics in the business explains why it changed?
A dashboard is great at monitoring the relationships we anticipate, and that's obviously the reason we built it. Even an alert is great at telling me a metric crossed a certain threshold, and I could set a million different alerts if I wanted to. But in a complex business, I can't anticipate every meaningful relationship ahead of time.
Instead of asking what happened to revenue, which I'm seeing here, I want the system to ask—I want the agent to go in and say—what's happening in the business today that deserves my attention? Are there any interesting relationships between signals and metrics that I should be aware of?
So, I'm going to come down here, and this is kind of what this AI investigator does. I'll show you how I built it on the back end. This is a great way to dip your toes in the water with agents, especially with Domo. It is very easy to do.
I'm going to run the AI investigation here. Conceptually, Domo is looking across a governed set of business signals. We're looking at revenue, traffic, conversion, inventory, marketing, and fulfillment. Obviously, these metrics will change depending on the industry or segment you're in. But again, we're not asking the LLM to magically understand every row in the company.
A big part of this conversation is cost. The reason why Domo works so well with this is because when we orchestrate workflows, we can include steps that run data flows at the time you want the agent to inspect the data. I'm not telling it to look at 20 different datasets and millions of different rows—the token cost there could be astronomical.
This is really looking at a "golden record" sales dataset. I probably have all of my sales and other metrics aggregated at the store level, potentially on a weekly or daily basis. I'm having it examine a much smaller, more data-rich dataset there. We're leveraging Domo to basically build those trusted metrics with the business context first. It's not examining a million different rows, so it can very quickly summarize and diagnose what's going on.
If we look at this here, it's found three different conditions that require attention. We'll go to the findings here. The one I really want to look at is that top one: the Mountain region revenue fell 14% despite traffic increasing 6%.
Remember what we saw up top—overall company revenue was up 3.8%. If I'm the executive, I might look at that first screen and think yesterday was a pretty good day. I probably don't start my morning asking, "Why is the Mountain region revenue declining despite increasing traffic?" I don't know to ask that. But the relationship itself is very interesting: if traffic is increasing, why is revenue falling? That's what the investigator surfaced.
Why don't I just put an alert on Mountain region revenue? I could create that and have it tell me every time it misses its revenue target. But that requires me to decide ahead of time that this specific condition is what I want to monitor. What's interesting here isn't simply that it went down, but that revenue went down while traffic went up.
Tomorrow, the interesting relationship might be something different. It might be returns versus product mix, or promotional demand versus inventory. I'm trying to surface meaningful relationships without having to create a dashboard or alert in the first place for every possible combination of metrics or signals.
Mark: So Dan, what is the context that you gave the agent in order for it to actually look for that kind of thing? Because to your point, I show up on that main page, I have my marketing console that I look at regularly, and what I would look at is: okay, we're up three-plus percent, pretty decent day. What have you done in the back to help point the agent to the key things where it would actually pull out a 14% drop versus an increase of 6% in traffic? What did you do there?
Dan: Yeah. So, back here on the workflow side, I mean, I have a pretty simple problem. Again, this is where I would urge you to reach out to your solution engineers. We're here for a reason—we want to help you get into the newer pieces of the tech, build the agents, and save time and money.
This is also something you can use AI for; it's very simple to explain what you're trying to do, and it can help you mock up a prompt so you can test and iterate.
I have a very simple prompt up here: "Review the latest available retail operating data. Identify the three most important conditions that deserve management attention. For each finding, explain what you discovered, why it matters, the evidence supporting it, the likely explanation, and what management should consider doing next."
This is more like the goal—the prompt can be pretty concise. The instructions are a bit longer, and that's something I refined over various iterations with AI as I got the answers, because you can test these right within Domo. You can use whatever model you want; the model is the intelligence, the brain. Domo is an agnostic platform, so you can really bring anything to the table here.
What I'm doing here is asking it to take an investigative approach: "Establish the overall health of the business using the latest business data available." I tell it to look for material changes, contradictions, unusual relationships, and emerging patterns across a ton of different metrics. These are all metrics that I've built into that gold record dataset, which is a very data-rich table aggregated to the store level.
Again, I'm not spending a ton of money on tokens; I'm having it look at more concise and aggregated information. But I even call out, "Look especially for relationships such as traffic increasing while revenue declines, or demand increasing while conversion drops." I can call out some of these different patterns that I might want it to look for—things I wouldn't uncover easily myself.
Then, I'm telling it to go through an iterative process: query the data, observe the results, decide what information is needed, query again, and compare related metrics between stores, regions, products, or dates.
I'm not a retail genius. This is something I sat down with using a conversational analytics piece, told it what I was looking for and what was typically missing, and built this out over time. It's very easy to do. What I love about this agent is it's very simple. An agent is taking that intelligence—that model—and adding tools, knowledge, and instructions. That's it. The only tool I've added here is query with SQL.
If we come here to edit, I've literally just added my gold record dataset, my Northstar Retail Daily Operating Signals dataset, right here. With that alone, that's the only tool it has because that's all I'm asking it to do. I'm asking it to be an analyst for me and find these relationships. I don't need anything more than this, which is a great way to dip your toes in the water, build an agent on one of your gold record datasets, and have it surface relationship signals that you normally wouldn't find on your own—though you would eventually.
Mark: So cool. Okay, Dan, where do we go from here?
Dan: Absolutely. Let's just jump back over. I'm going to hit "investigate" here, and we'll look at how the investigator reaches conclusions.
Here's what the system found: traffic increased 6.1%, so demand doesn't appear to be our problem. We're actively running a promotion, and engagement with that promotion actually increased 17%. But then the investigator finds something interesting: three of the promoted SKUs stocked out. Our in-stock rate fell from 94% to 71%, and conversion dropped from 28% to 19%.
So, we now have a chain of evidence: traffic increased, the promotion successfully created demand, inventory availability collapsed, conversion collapsed, and revenue declined.
We can even go a level deeper and come down here to the fulfillment signals. I can bring all sorts of information in and see under the fulfillment signals that a shipment arrived 31 hours late. We can combine that structured operational data with unstructured customer feedback. Under customer experience, we see: "I came in because of the promotion, but the product was sold out. This is the second time this week the advertised item wasn't available."
We're starting to see what the pattern is—the investigator can form a much more complete conclusion. We're successfully paying to create demand for inventory we don't have available. So, it's a lot more useful than just simply telling me the Mountain region missed its number. I've already got the "why," and I can already take action.
Down here, I've added some additional pieces about why this was easy to miss. These are all optional things we can add or not, but they are central to the use case. Why was this easy to miss? Company revenue was above plan, marketing looked good because engagement increased, and traffic even looked good. The fulfillment team sees a delayed shipment, the inventory team sees a decline in availability, and the store team sees conversion failing.
Each individual system is telling a part of the story, but the value comes from connecting all the signals together. That's where I think AI gets really interesting. It's not just "give me a prettier summary of the dashboard." It's "find relationships across the business that aren't obvious when I look at each metric independently."
Mark: So intriguing, Dan, especially when you look from that demand capture perspective. What would likely happen in a retail scenario like this is the GM would get a note asking, "Why is that Mountain region down by 14%?" And the response would be, "Well, we're just not getting enough people coming in."
But that's far from the truth. In this case, there is not a demand problem. The problem is that you got a shipment 31 hours late, so you didn't have the product.
You would hope in a retail scenario that this stuff is going to be brought to light on the floor, but maybe not. You have so many stores. Uncovering these things 12 hours ahead instead of at the end of the day means you can recover revenue levels quickly or increase them, whereas at the end of the day, that day is shot. Let's try again tomorrow, right?
Dan: Exactly. It's all about speed of insight and speed of taking action. That's really where this leads us, which is why I love Domo. We're always talking about agents and intelligence, but at the end of the day, intelligence by itself doesn't create business outcomes. It's intelligence plus action.
Eventually, someone has to do something. We recommended three actions: we have 420 units available in nearby stores that we could transfer over; we could pause the promotion in the affected zip codes until inventory recovers so people aren't going to the store for this promotion and not finding it; and we could escalate the delayed replenishment shipment. We could even just assign this to someone to start taking action.
This is where workflows and Domo as a platform are very interesting, because you get the intelligence and you get the action. That's what leads to the business outcomes, and that's what's going to lead to recovering revenue for that day or that particular impact.
Down here, I'm not going to go too much into the workflows. I have different buttons that are going to trigger workflows to hit APIs across your tech stack, notify individuals, or send emails. You could have an execute response plan where it's literally doing some of the recommendations that I had on here.
But again, we've moved through the entire cycle: detect, investigate, explain what's happening, make a decision, and then act. We've actually taken action on the insights that were given and recommended—these insights aren't just dying on the dashboard.
I don't have much more on the solution side. If we think about other areas that move fast, like manufacturing: throughput looks normal at the plant level, but one production line is consuming more energy, experiencing slightly longer cycle times, and producing a growing number of minor quality exceptions. None of those things individually cross an alert threshold, but together they're an early indicator of equipment degradation.
In logistics and supply chain, same thing: a shipment hasn't reached its SLA yet, but weather, port congestion, inventory coverage, and current transit velocity together suggest that it will miss its SLA timeline. This could be hospitality, SAS, or anything where things move quickly. Using AI as an analyst to uncover these things you're not even thinking about can have a huge impact on the business.
I'll just leave it there. It's why I love Domo—the insights don't die on the dashboard. You have the intelligence, but if you're not acting, it doesn't result in outcomes. That makes Domo such a powerful platform; you aren't jumping around, you're doing everything from here. Instead of an app, it's honestly more of a command center.
Mark: You may have seen that note that came in from Justin on LinkedIn. He says, "One of AI's greatest strengths is pattern recognition. Uncovering those relationships between disparate issues and providing the operators the knowledge they need at speed is the exact type of solution that companies need to be taking."
Dan, is BI dead?
Dan: Oh, no. Absolutely not. Again, we're not getting rid of the dashboards or the conversational analytics. These are all just evolutions of getting insights and acting on them faster.
Just like you said, the goal isn't simply to answer questions faster either; it's to surface signals and patterns you didn't know to look for. Thinking back to machine learning in the beginning and pattern recognition, how can you do that quickly and shorten the distance between something changing in the business and somebody actually doing something about it? I think that is where Domo is integral.
We're moving from a dashboard to a decision engine. But even with the dashboard, I can still come in and look at the signal. It just helps me investigate, take action faster, and see the actual signals that are helping AI reach that conclusion.
Together, it's a "better together" story, helping us move faster and justify our decisions. Do I trust AI just because it told me something? Absolutely not. It told you something; go check the analytics on the BI side of things and make sure whatever assumption it's making is correct.
Mark: I love it. I love it. You heard it here, everybody. We're coming back again in just a couple of days with another demo of how you could and should be using AI to drive business outcomes. Dan, thanks for joining us today. We will see everybody soon.
Dan: Thank you.

Mark brings over 15 years of diverse marketing experience and is passionate about driving Domo’s business growth through marketing initiatives. His mission is to empower all Domo customers and prospects with the insights and tools they need to make better business decisions and achieve their goals. In his previous role as VP of Community, Partner, and Field Marketing, Mark and his teams established new and strengthened existing programs to address customer pain points and create a greater sense of community. They also executed campaigns, programs and events that showcased the value of the Domo platform. Before joining Domo, Mark spent more than 10 years working in customer relations and marketing at Adobe, and worked at Instructure as its senior director of customer marketing. He received his MBA from Utah State University and a bachelor’s degree from Brigham Young University. Outside of work, Mark enjoys spending time with his family and traveling.
Built around a national retail operation, the AI Business Investigator starts every morning by answering the questions leaders already care about: How did we perform yesterday? Which regions missed plan? Where is inventory at risk? Which promotions are working? Then it goes further. It evaluates signals across sales, traffic, conversion, inventory, marketing, fulfillment, and customer experience to identify material conditions and unexpected relationships that otherwise go unnoticed.
Company revenue may be above plan while one region is quietly deteriorating. Traffic may be increasing while conversion collapses. Marketing may be creating demand for inventory that stores no longer have. Instead of waiting for someone to notice the symptom and ask why, the investigator surfaces the condition, connects the evidence, explains what is happening, estimates the business impact, and recommends what to do next.
The goal isn't just to answer questions faster. It's to surface the signals and patterns you didn't know to look for, and to connect signals across the business that aren't obvious in any single dashboard.
Featured Session: Inside the AI Business Investigator
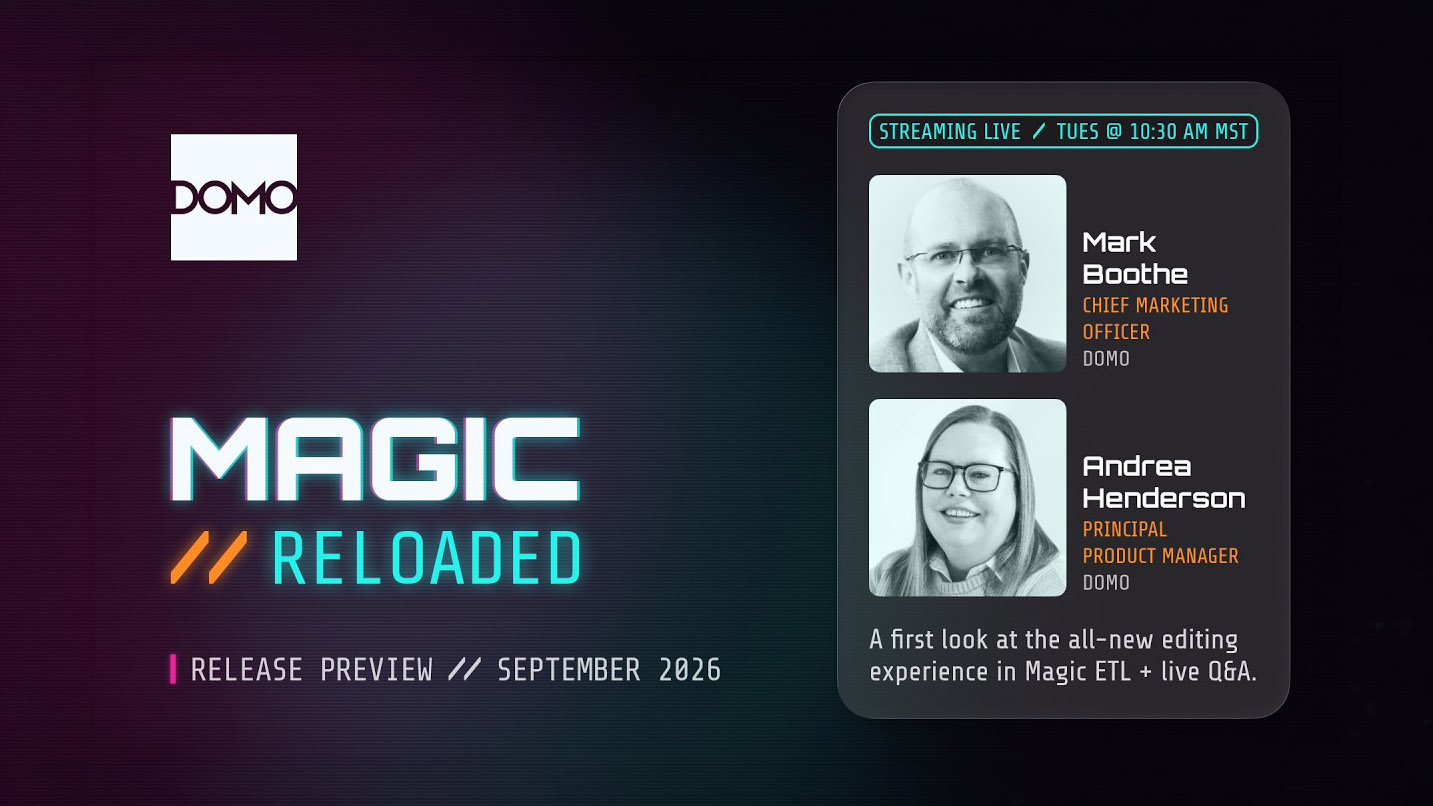
Join Domo CMO Mark Boothe and Dan Wentworth, solutions engineer manager at Domo, for a live look at an AI-powered retail decision engine built on Domo. We'll start where traditional analytics usually ends: a healthy executive brief showing revenue, traffic, conversion, inventory, and promotional performance. Then we'll launch the Investigator and ask a different question: What is happening in the business today that we haven't thought to look for?
You'll see the investigator detect a condition hidden beneath positive company-level performance: one region's revenue is falling even as customer traffic increases. From there, it connects signals across store performance, inventory, marketing, fulfillment, and customer feedback to uncover the underlying issue.
The investigator doesn't stop at the anomaly. It builds the evidence trail, estimates financial impact, recommends a cross-functional response, and routes the decision into a simulated Domo Workflow where a human can approve the next action.
Designed for retail, but applicable anywhere conditions change faster than people can monitor them.
WHAT YOU WILL SEE
• Answers before you ask: The daily brief automatically answers the questions retail leaders ask every morning.
• AI-detected conditions: The investigator looks for material changes and unexpected relationships not visible in standard reporting.
• Cross-functional investigation: AI connects sales, traffic, conversion, inventory, promotions, fulfillment, and customer feedback to explain the underlying issue.
• Evidence and impact: Every finding includes supporting metrics, confidence, business impact, and why it may have been easy to miss.
• From insight to action: Recommended responses can be routed into Domo Workflows for human approval and operational follow-through.
Domo transforms the way these companies manage business.