Mit der automatisierten Datenfluss-Engine von Domo wurden Hunderte von Stunden manueller Prozesse bei der Vorhersage der Zuschauerzahlen von Spielen eingespart.
Schau dir das Video an

Variance charts answer one question fast: Are we ahead or are we behind? In this guide, we'll explain what variance charts are, walk you through the data requirements and calculation logic, cover when to use them (and when to pick a different visualization), and show you step by step how to build one in Excel.
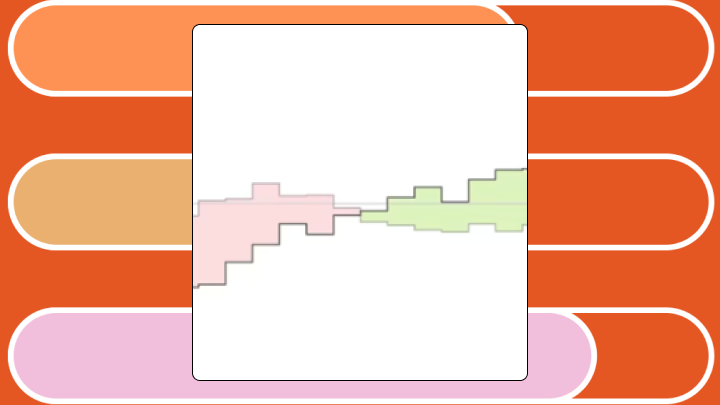
A variance chart is a visualization that shows the difference between two values, like actual vs budget, as the main visual element. Instead of showing two bars side by side and making you do the math, it shows only the gap.
Here's what you need to know before building one:
Position and length. That's it. A variance chart uses these two visual properties to show the signed difference between two values. The baseline sits at zero (or a reference line), and bars extend left or right to indicate favorable or unfavorable variance.
Unlike a standard bar chart where bar length represents magnitude, a variance chart's bar length represents only the gap. A small bar could mean a massive absolute value with a tiny deviation. Or it could mean a small absolute value with a proportionally large deviation. Context matters here, and this is where I've seen teams stumble repeatedly.
This explains why BI analysts and finance, sales, and operations leaders gravitate toward variance charts in business intelligence dashboards. With 50 percent of CFOs prioritizing digital transformation of finance heading into 2026, the pressure to surface insights quickly has never been higher. Variance charts deliver exactly that kind of quick "performance gap radar" for spotting what's off track without a bunch of follow-up questions. They cut down on the back-and-forth of people asking for yet another variance breakdown.
You'll often see variance charts integrated into tables, bullet charts, or waterfall charts rather than standing alone. Pairing them with absolute values prevents the inevitable "but what's the actual number?" question.
If your dataset lacks a meaningful comparison column (budget, forecast, prior period), a variance chart can produce misleading output (and in some tools may render as blank).
Your data needs these fields at minimum:
These fields improve the chart but aren't required:
Three rows or categories are the minimum for meaningful pattern recognition. A single-row variance chart? That's just a number with extra steps.
The data also needs to be consistent, not just present. If actuals live in one system and targets live somewhere else (often a spreadsheet), you need a reliable join and refresh process so the variance chart reflects the same time grain, currency, and filters across both columns. This is where data engineers get pulled in, because brittle pipelines and schema changes can turn simple variance into a monthly fire drill. According to Gartner, poor data quality costs organizations at least $12.9 million a year on average.
If multiple teams calculate variance differently, trust collapses fast. Defining actuals, targets, and difference calculations once in a governed semantic layer (your shared metrics definitions) helps you get to one definition of variance everywhere, so your executive dashboard and your team dashboard stop disagreeing.
Treat variance charts cautiously when the baseline is zero or near zero, because percent variance can become undefined or extreme. Also avoid comparing values with different units or scales. Mixing revenue in dollars with headcount, for instance, will produce a chart that's technically correct but practically useless.
The basic formulas are straightforward. Absolute variance equals actual minus plan. Variance percent equals (actual minus plan) divided by plan. Wrap percent calculations in IFERROR to handle division by zero.
"How far off are we?"
That's the question this chart answers. It works best when stakeholders need to scan for exceptions across many categories or time periods, and when you have a stable baseline that the audience trusts.
It also earns its keep in executive and manager views where time is tight. If someone has three minutes before a leadership meeting, they don't want to hunt through a report export to figure out where the gap is.
Avoid this chart when stakeholders need to see absolute magnitude. A variance chart showing positive five percent tells you nothing about whether that represents $500 or $5 million. Also avoid it when comparing more than two scenarios. Actual vs budget vs forecast vs prior year requires a different approach entirely.
If the baseline is arbitrary or frequently revised, variance becomes noise. Mixing cost and revenue metrics without a polarity flag creates confusion, because positive variance means opposite things for each.
If you choose it anyway, expect executives to ask for the actual number. You will see misinterpretation when small absolute values show large percentage variances. Confusion happens when favorable direction isn't visually obvious.
Bar direction registers before bar length. Viewers instinctively scan for which bars cross the baseline in the wrong direction before assessing magnitude.
Follow this interpretation order:
Misinterpretation often occurs when people assume all rightward bars are good without checking polarity. Cost metrics flip this logic entirely. People also overreact to long bars without checking the axis scale. A bar that looks dramatic might represent a variance of just two percent if the scale is tight.
Consistent direction across categories suggests a systemic issue rather than random variation. A single outlier bar warrants investigation before action.
A finance team once built a variance chart where green meant positive variance, but the metric was cost. The green bars actually indicated overspending. They celebrated budget overruns. (It happens more often than anyone wants to admit.)
Color should tie to favorable or unfavorable outcomes, not to positive or negative numeric signs. Label variance values directly on bars rather than relying on axis reading. Use consistent scale across all categories. Make the zero line visually distinct. Sort by variance magnitude with largest unfavorable first, unless time-series order is required.
If your organization has multiple dashboards for the same KPI, consistent formatting is only half the battle. Consistent definitions matter too, because variance gets messy when one team uses budget, another uses forecast, and a third filters out returns.
Teams operating in International Business Communication Standards (IBCS) environments should follow specific notation for variance charts, including integrated variance columns and consistent color semantics.
Not all variance visualizations work the same way. The right choice depends on what comparison matters most.
For executive dashboards, bullet charts provide actuals, targets, and variance in one space. For operational exception reporting, diverging bar charts let managers instantly spot failures. For financial presentations, waterfall charts explain exactly how you got from planned to actual.
When comparing variance across many segments (regions, product lines, business units), small multiples outperform a single cluttered chart. Each panel shows the same structure for a different segment.
Lock the scale across all panels. A positive five percent variance in one panel should look different from positive 50 percent in another. Arrange panels so largest unfavorable variances appear first. Limit to 12 to 16 panels before switching to a table with embedded sparklines.
A finance team reviews eight departments' spending against budget. A grouped bar chart shows actual and budget side by side, but the variance requires mental calculation. A variance chart shows immediately that three departments are over budget and by how much.
IT and Marketing are significantly over budget. Operations is under by a similar margin. This becomes obvious instantly. A bar chart hides this because the eye compares bar heights rather than computing differences.
A sales dashboard tracks eight regions against prior-year performance. A variance chart sorted by magnitude reveals that two regions account for most of the shortfall, while four regions are actually ahead.
The overall negative variance is concentrated, not distributed. Intervention should focus on two regions, not all eight.
Excel lacks a native variance chart type. You create one by calculating variance in your data and building a bar chart that treats variance as the value.
Start by adding a column calculating variance by subtracting plan from actual. Add a column for variance percentage if needed, wrapping it in IFERROR. Optionally add a polarity flag column.
Verify that the sum of all variances equals total actual minus total plan. If it does not, check for mismatched filters, missing categories, or a calculation error.
Forgetting to set the axis crossing point to zero results in all bars extending from the left edge rather than diverging from center. This is the single most frequent mistake. It completely undermines the visual logic of the chart.
Conditional coloring by value requires splitting positive and negative values into separate series or using VBA. For ongoing reporting, BI tools reduce this manual formatting effort considerably. McKinsey found one FP&A initiative cut time spent on data manipulation by 65 percent, freeing analysts to focus on insight rather than spreadsheet wrangling. This matters especially when you need reusable templates and consistent metric logic across multiple dashboards.
Variance charts optimize for surfacing gaps. This focus creates blind spots.
They can't show absolute magnitude (so pair them with actuals when that context matters). They also don't handle more than two comparison points. A single variance chart is a snapshot with no trajectory.
If stakeholders keep asking for the actual number, add a paired view or switch to bullet charts. If you need to explain why variance occurred, use a waterfall.
Variance charts earn their place when the question people ask, "Where are we off track?" The charts surface exceptions, direct attention to gaps, and compress budget-to-actual comparisons into scannable visuals.
You lose magnitude context, and you need clean baseline data. For teams running monthly budget reviews or quarterly forecast comparisons, that sacrifice pays off.
Before building, confirm you have a stable comparison value, consistent polarity logic, and stakeholders who understand they're looking at gaps, not totals.
Domo BI can help you stop explaining the gap and show it. When your actuals and targets come from different places (for example, targets in Excel and actuals in Salesforce), Domo's data integration layer can bring them together, and Magic Transform can handle the joins and delta calculations that power the variance chart. You can also define the metric logic once in a semantic layer, then reuse it across executive and team dashboards so the numbers stay consistent.
Ready to turn "are we ahead or behind?" into a dashboard you can trust, without the monthly spreadsheet rush? Try free and build variance charts that auto-refresh from your actuals and targets.


