Mit der automatisierten Datenfluss-Engine von Domo wurden Hunderte von Stunden manueller Prozesse bei der Vorhersage der Zuschauerzahlen von Spielen eingespart.
Schau dir das Video an
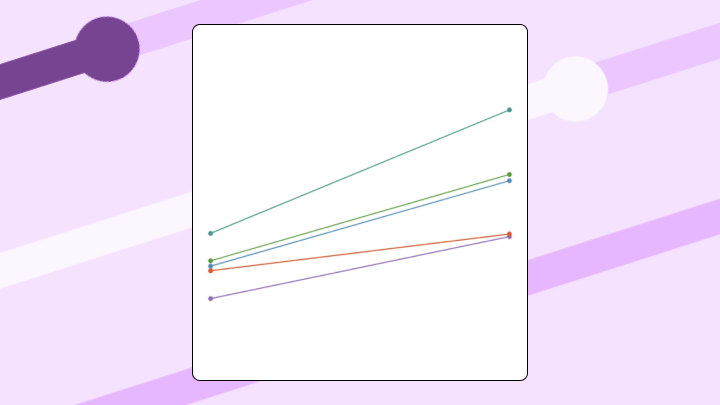

A slope chart connects two values per category with a single line. It let's people easily see direction and magnitude of change at a glance. In this article, we'll explain what slope charts are, walk through data requirements and construction steps, and identify when alternatives like line charts or dumbbell charts work better.
"So…what changed since last quarter?" If your stakeholders keep asking this question, a slope chart is often the cleanest answer. It shows the shift. Not just the number.
After about 15 categories, slope charts fall apart. Lines overlap, labels collide, and the visual clarity that makes this format useful disappears entirely.
Use a slope chart when you're comparing exactly two time points or two conditions, when the story is about direction and magnitude rather than the path between points, and when rank shifts matter more than absolute values. BI analysts and line of business managers love slope charts for quick before-and-after key performance indicator (KPI) check-ins. Nobody has to squint at a multi-line trend chart to get the point.
Skip it when intermediate values matter. If you need to know whether revenue spiked in Q2 before dropping in Q4, a slope chart hides that trajectory completely and a line chart is the better call.
Also skip it when categories have no logical relationship. Comparing revenue vs headcount vs NPS on the same slope chart produces meaningless slopes because the metrics aren't comparable. The slopes will only look dramatic, but they won't show anything you can use.
Force a slope chart into the wrong scenario and expect confusion. Stakeholders will ask what they're looking at. The tangled mess of lines will obscure the exact insight you wanted to highlight.
A slope chart connects two data points per category with a single line segment. The angle of each line shows whether values went up, down, or stayed flat between two specific moments. You might also hear it called a slopegraph.
Think of it as a before-and-after snapshot. Left side: where things started. Right side: where they ended. The lines between tell you who gained ground and who lost it.
This format strips away everything except the comparison that matters. No intermediate noise. No distracting data points. Just the change itself, made visible.
If you've ever tried to explain which regions improved and which slipped to a sales leader, or which product lines climbed in customer satisfaction to an executive, you already get the appeal. A slope chart makes directional change feel obvious, even for people who don't want a mini class in data visualization. That matters when poor data literacy is one of the top 5 roadblocks to analytics success, according to Gartner. The visual does the cognitive work for the viewer, which guides often skip over.
People often confuse slope charts with similar visualizations, so here's how they differ:
Before you worry about angles and labels, make sure the data is shaped for a two-point comparison.
At a minimum, your dataset needs:
If your endpoints come from different systems, the definition has to match too. A slope chart is only as credible as the data behind it. Teams can end up debating numbers instead of decisions when "revenue" or "conversion rate" gets calculated differently across dashboards. Precisely's 2024 survey found this affects 45 percent of organizations due to inconsistent data definitions and formats. For slope charts specifically, this inconsistency can make a line appear to show growth when the underlying metrics aren't even measuring the same thing.
This is where data engineers feel the pain. Source data often arrives as a long table with timestamps, or from multiple connectors with slightly different naming and granularity. You usually need a transformation step to pivot or aggregate into the two endpoint columns, and to standardize metric definitions so every chart tells the same story.
In platforms like Domo, teams can connect and refresh data from many sources, reshape it with tools like Magic ETL (no-code) or Magic SQL (SQL-based transformations), and then build the slope chart on top of that prepared, governed dataset.
Your eye processes these charts in a predictable sequence. First, you notice the steepest slopes. They represent the most dramatic changes. Then you scan for lines that cross each other. Finally, you read the endpoint labels to understand what you're actually looking at.
The angle tells the story. Upward slope means the value increased. Downward slope means it decreased. Steeper angles indicate larger changes. Flat lines show minimal movement.
Interpretation gets tricky here. Crossing lines look like rank reversals, but that's only true if the chart shows ranked data. If you're looking at raw values, crossings might just reflect different scales of change. Always check whether you're looking at ranks or absolute numbers before drawing conclusions.
Slope charts handle two distinct scenarios. The interpretation shifts depending on which one you're in.
For time-based comparisons, the two endpoints are time periods (Q1 vs Q4, or 2020 vs 2024). The slope shows whether a metric increased or decreased over that interval.
For categorical comparisons, the endpoints represent different conditions (Control vs Treatment, or Region A vs Region B). The slope reveals where differences exist between those groups.
The chart looks identical either way. But the question it answers changes completely.
A CFO needs to show the board how budget shifted from Q1 to Q4 across eight departments. A slope chart instantly reveals that marketing dropped while engineering rose. Three departments stayed flat. A grouped bar chart would require mental subtraction to see the same pattern.
A sales operations analyst comparing regional revenue from Q1 to Q2 can use the same setup. The point isn't every weekly bump. It's which regions gained ground and which fell behind.
A marketing analyst compares brand awareness before and after a campaign across five regions. Two regions improved dramatically. One stayed flat. Two declined. A table of numbers would bury this insight. The slopes make winners and losers visible at a glance.
You can do the same thing for channel-level conversion rates before and after a campaign launch. When you need a quick performance narrative, being able to say "here are the biggest movers" lands better than a spreadsheet. Always does.
Product teams tracking customer satisfaction rank across 10 product lines between 2023 and 2024 can see immediately that Product D jumped from eighth to second while Product A fell from first to fifth. A bump chart could show this across more time points, but for a two-year comparison, the slope chart is cleaner.
Executives also use slope charts to scan year-over-year Net Promoter Score (NPS) across product lines. It's a single view that shows which products improved customer sentiment and which ones need attention before the next leadership meeting.
Bar charts force audiences to compute change in their heads. Line charts add noise when only two points matter. Tables hide patterns in rows of numbers.
Your data needs a specific structure. Three columns minimum: category name, value at the first endpoint, value at the second endpoint.
Follow these steps:
If you see one line zigzagging across all categories instead of separate lines per category, you skipped step four. Go back to Select Data and click Switch Row/Column.
Excel does not natively support slope charts. This workaround requires manual formatting, and labels frequently overlap. Every time the dataset updates, you'll likely need to adjust label positions by hand. Time-consuming work.
For dashboards that update regularly, BI tools like Domo handle this chart type in the visualization library, so people can build and reuse the same slope chart configuration across dashboards instead of rebuilding it every time a new "before vs after" request pops up.
The two-point constraint is the biggest limitation. Slope charts can't show what happened between endpoints. If the path matters, you need a line chart.
Label collision becomes unavoidable past 15 categories. No formatting trick fixes this.
Outliers can compress all other slopes into near-flat lines. One extreme value hides all the meaningful variation in your data. If you suspect an outlier is distorting your chart, consider removing it and noting it separately, or switching to a chart type that handles scale differences better.
Slope charts show change, not magnitude. Two categories with identical slopes might have vastly different absolute values. This trips people up more often than you'd think.
There's also a non-visual limitation that shows up in large organizations. If teams use different metric definitions (or pull the two endpoints from different sources with conflicting numbers), you can end up with multiple slope charts telling multiple truths. DATAVERSITY's 2025 survey found 75 percent of leaders don't trust their data for decision-making, often due to issues like this. Slope charts amplify the problem because they make change so visually prominent that conflicting versions become impossible to ignore. Standardizing definitions upstream through a governed metrics layer or semantic layer keeps the conversation on what changed instead of whose dashboard is right.
Match the limitation to the right alternative:
Here are the main points to remember:
Slope charts answer one question cleanly: what changed between two points? They strip away intermediate noise and make direction visible at a glance.
Choose this format when you have exactly two time points or conditions, fewer than 15 categories, and a story about relative change rather than absolute values.
If you find yourself plotting more than two endpoints, stop. You probably need a line chart instead.
Teams building dashboards that update regularly will find that slope charts in platforms like Domo require far less manual formatting than spreadsheet workarounds. In Domo, people can explore the same chart on interactive, mobile-ready dashboards. In Domo, the chart can sit on top of connected, transformed, governed data so the "before" and "after" stay consistent. If you want tips and practical examples from folks building these before vs afterviews every day, join the Domo community.


