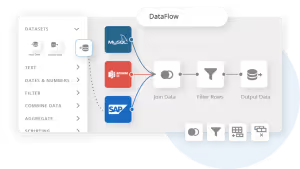
Mit der automatisierten Datenfluss-Engine von Domo wurden Hunderte von Stunden manueller Prozesse bei der Vorhersage der Zuschauerzahlen von Spielen eingespart.
Schau dir das Video an


The term "business intelligence applications" carries genuine ambiguity. It refers to everything from how companies use data to drive decisions, to the software platforms that make analysis possible, to packaged enterprise suites from vendors like Oracle and SAP. This guide breaks down all three meanings, walks through 10 common BI use cases across industries, compares leading tools, and helps you decide whether an off-the-shelf solution or custom application fits your organization best.
Here are the main points to keep in mind:
Business intelligence applications are software tools that help business managers and executives make more informed decisions. They transform raw data into insights you can actually act on. That's the core promise.
The phrase "business intelligence applications" can refer to three distinct things:
These tools work for businesses of any size. A company with thousands of employees and a startup with a handful of people can both put BI to work. Industry doesn't matter either.
For the most part, BI tools use dashboards and reporting that include data visualizations to convey complex ideas in an easy-to-understand method for any viewer. Modern platforms increasingly incorporate AI and machine learning to surface insights automatically, predict trends, and recommend actions.
Self-service BI has become a defining feature of modern platforms. The concept is straightforward: people across the business can explore data and build their own reports without waiting for IT or a data team. Governed self-service takes this a step further. People across the business can explore data freely within guardrails set by IT or data teams, ensuring that the metrics they use are accurate and the data they access is appropriate for their role. Assuming self-service means no governance at all? That's how you end up with dozens of conflicting reports and eroded trust in the numbers.
Understanding what BI can do starts with recognizing the different types of applications it enables. Rather than thinking of these as a flat list of features, it helps to organize them by the kind of decision they support: strategic decisions that shape long-term direction, tactical decisions that guide departmental priorities, and operational decisions that happen in the moment.
The following 10 applications represent the core ways organizations put BI to work:
A BI dashboard consolidates data from multiple sources into a single view, giving teams real-time visibility into the key performance indicators (KPIs) that drive decisions. Unlike static reports that capture a moment in time, dashboards update continuously and allow people to drill into the details behind any metric.
Executive dashboards typically focus on high-level strategic indicators: revenue trends, market share, customer acquisition costs. Operational dashboards track the metrics that matter minute-to-minute (order fulfillment rates, support ticket volumes, production line efficiency).
The best dashboards answer questions before anyone has to ask them.
Data mining uses statistical techniques and algorithms to discover patterns in large datasets that would be impossible to spot manually. This is more than simple reporting. It's about finding relationships and structures in your data that reveal new opportunities or risks.
Common data mining applications include market basket analysis (what products are frequently purchased together), customer segmentation (grouping customers by behavior rather than demographics), and anomaly detection (identifying transactions or events that don't fit normal patterns). Just because two variables move together does not mean one causes the other. Acting on spurious correlations leads to misguided decisions.
Instead of just telling you what happened, predictive analytics helps you anticipate what's likely to happen next.
Demand forecasting helps retailers stock the right products in the right quantities. Churn prediction identifies customers at risk of leaving before they actually leave. Risk scoring helps financial institutions assess creditworthiness. These applications share a common thread: they turn backward-looking data into forward-looking guidance.
Tracking KPIs isn't enough. Someone needs to own them, review them at a regular cadence, and take action when they drift off target.
Effective performance management requires clarity on three questions: Who owns this KPI? How often do we review it (daily, weekly, monthly)? What triggers action? A dashboard that shows revenue is down 5 percent is useful. A system that alerts the sales director on Monday morning and prompts a review of pipeline coverage is actionable.
Benchmarking extends this internally (comparing performance across regions, teams, or time periods) and externally (comparing against industry standards or competitors).
Embedded analytics delivers BI capabilities inside the applications people already use rather than requiring them to switch to a separate analytics tool. A logistics platform might show delivery performance metrics directly in the dispatcher's workflow. A software as a service (SaaS) product might surface usage analytics to customers within their account dashboard.
Self-service BI, by contrast, gives people across the business the tools to build their own reports and explore data without IT involvement. The distinction matters: embedded analytics is about surfacing insights in context, while self-service is about enabling exploration.
Both approaches reduce dependency on centralized analytics teams, but they have different prerequisites. Embedded analytics requires multi-tenant security and careful user experience (UX) design. Self-service requires a governed semantic layer so that people across the business are working with consistent, trusted metric definitions.
FP&A applications support budgeting, forecasting, variance analysis, and scenario planning. They connect operational data to financial outcomes.
Modern FP&A tools integrate with enterprise resource planning (ERP) systems, customer relationship management (CRM) platforms, and operational databases to create a unified view of financial performance. They enable rolling forecasts that update continuously rather than annual budgets that become obsolete within months. And honestly, the shift from static annual budgets to rolling forecasts is where most finance teams see the biggest immediate payoff.
Who are your customers? How do they behave? What drives their decisions? Customer analytics applications tackle these questions through customer lifetime value modeling, segmentation, journey analysis, and sentiment tracking.
The goal is to move past demographic profiles to behavioral understanding. Two customers might look identical on paper but have completely different purchasing patterns, support needs, and churn risks.
Supply chain BI provides visibility into inventory levels, supplier performance, logistics efficiency, and demand patterns. It helps organizations balance competing priorities: minimizing inventory costs while avoiding stockouts, optimizing delivery routes while meeting service commitments.
Operations analytics extends this to manufacturing, quality control, and process optimization. Predictive maintenance applications, for example, use sensor data to anticipate equipment failures before they cause downtime.
Sales analytics tracks pipeline health, conversion rates, quota attainment, and sales cycle length. Marketing analytics measures campaign performance, attribution, customer acquisition costs, and return on marketing spend.
The most valuable applications connect these domains. Understanding which marketing channels produce not just leads but revenue-generating customers requires integrating data across the entire customer journey.
In regulated industries, BI applications support compliance monitoring, audit preparation, and regulatory reporting. This includes tracking adherence to internal policies, monitoring for suspicious activity, and generating the reports that regulators require.
These applications demand strong governance capabilities: row-level security to control who sees what, audit trails to document who accessed which data, and data lineage to trace how metrics were calculated.
BI applications look different depending on the industry. The underlying capabilities are similar, but the KPIs that matter, the data sources required, and the pitfalls to avoid vary significantly.
Retail BI focuses on inventory optimization, customer behavior analysis, and personalization. The leading KPIs include inventory turnover rate, sell-through rate, customer lifetime value, and conversion rate by channel.
Data sources typically include point-of-sale systems, e-commerce platforms, inventory management systems, and customer data platforms. Ignoring regional or seasonal demand variation causes problems here. A dashboard that shows aggregate inventory health can mask stockouts in specific locations or categories.
Companies like Target use BI to optimize store layouts based on shopping patterns. Amazon's recommendation engine is, at its core, a BI application that analyzes purchase history and browsing behavior to predict what customers want next.
Healthcare BI supports patient outcomes improvement, operational efficiency, and population health management. Key metrics include 30-day readmission rates, average length of stay, patient satisfaction scores, and care quality indicators.
Data sources span electronic health records, claims data, patient surveys, and increasingly, data from wearable devices and remote monitoring systems. The critical challenge is data integration. Patient information is often fragmented across systems that do not communicate well with each other.
Successful healthcare BI implementations prioritize data quality and governance. Incomplete patient histories lead to inaccurate risk stratification, which undermines the entire value proposition.
Financial services BI addresses fraud detection, risk management, customer analytics, and regulatory compliance. Leading KPIs include fraud detection rate, false positive rate, customer acquisition cost, and assets under management.
Data sources include transaction systems, credit bureaus, market data feeds, and customer interaction logs. BI applications in regulated industries require row-level security and audit trail capabilities. Not just dashboards, but governance infrastructure that can demonstrate compliance to regulators.
American Express uses BI to detect fraudulent transactions in real time, analyzing spending patterns to identify anomalies before they result in losses.
Manufacturing BI focuses on production efficiency, quality control, and supply chain visibility. Key metrics include overall equipment effectiveness (OEE), defect rates, on-time delivery percentage, and inventory days on hand.
Data sources include manufacturing execution systems, internet of things (IoT) sensors, ERP platforms, and supplier management systems. The opportunity in manufacturing is predictive maintenance: using sensor data to anticipate equipment failures before they cause unplanned downtime.
DHL uses BI to monitor cold chain compliance across global shipments, tracking temperature data from IoT sensors to ensure pharmaceutical products remain within required ranges throughout transit.
The BI tools landscape has evolved significantly. What was once a market dominated by a few enterprise vendors now includes cloud-native platforms, self-service tools, embedded analytics specialists, and open-source options.
When evaluating tools, it helps to map them to the application categories covered earlier. Different platforms excel at different things:
| Tool | Best For | Data Unification Method | Key Strength | Consideration | Pricing Model |
|---|---|---|---|---|---|
| Power BI | Enterprise reporting and dashboards | Import or DirectQuery to data sources; integrates with Microsoft Fabric for unified lakehouse | Deep Microsoft ecosystem integration, strong semantic layer | Requires Microsoft stack for full value | Per-user licensing, free tier available |
| Tableau | Visual analytics and data exploration | Connects to data sources via live connection or extract; Tableau Prep for data preparation | Industry-leading visualization capabilities | Can become expensive at scale | Per-user licensing |
| Looker | Semantic-layer-driven self-service | LookML semantic layer queries data warehouse directly | Code-based metric definitions ensure consistency | Steeper learning curve for LookML | Per-user licensing (Google Cloud) |
| Qlik Sense | Associative exploration and discovery | Associative engine brings together hundreds of sources | Unique associative model reveals hidden relationships | Complex licensing structure | Capacity-based and per-user options |
| Domo | Connector breadth and data unification | Over 1,000 pre-built connectors; Adrenaline data layer for unified storage | Fastest path to unified data from disparate sources | Enterprise pricing | Per-user licensing |
| Metabase | SMB and open-source deployments | Connects directly to databases | Simple setup, generous free tier | Limited enterprise governance features | Open source with paid cloud option |
Domo's connector ecosystem deserves specific mention in the context of data unification. For organizations with data scattered across dozens of SaaS applications, the ability to connect and unify sources without building custom ETL pipelines can dramatically accelerate time to value.
Selecting a BI platform requires evaluating capabilities across several dimensions. The following questions help structure the evaluation:
Does the platform support a shared semantic layer so metric definitions stay consistent across teams? A semantic layer translates raw database fields into business-friendly terms and ensures that "revenue" means the same thing in every report.
How does the platform handle data unification? Some tools import data into their own storage layer. Others query a central data warehouse directly. Understanding this architectural difference matters. A BI tool that imports data creates a copy that can drift out of sync, while one that queries the warehouse directly always reflects current data.
What security and access controls are available? Row-level security (RLS) controls which rows of data each person can see. Role-based access control (RBAC) determines which features and datasets each person can access. For organizations with sensitive data or regulatory requirements, these are not optional.
Does the platform support certified or endorsed datasets? Certification workflows allow data teams to designate trusted data sources, helping people across the business distinguish between governed, production-ready datasets and experimental or unvalidated ones.
Can you trace data lineage? Lineage shows where a metric came from and how it was calculated.
Enterprise buyers must evaluate governance capabilities as carefully as they evaluate visualization features. Here are the questions to ask vendors:
Row-level security (RLS): Can the platform restrict data access at the row level based on each person's attributes? A regional sales manager should see only their region's data, even when viewing the same dashboard as the VP of Sales.
Role-based access control (RBAC): Can you define roles with specific permissions and assign people to those roles? This is the foundation of scalable access management.
Certified datasets: Does the platform support a certification workflow where data teams can mark datasets as trusted and production-ready? This helps prevent the proliferation of ungoverned, potentially inaccurate data sources.
Data lineage: Can people trace a metric back to its source data and understand the transformations applied along the way? Lineage is essential for debugging, compliance, and building trust.
Audit trails: Does the platform log who accessed what data and when? For regulated industries, this is not optional. It is a compliance requirement.
These capabilities protect against dashboard sprawl where no one knows which reports to trust, metric inconsistency where different teams report different numbers for the same question, and security gaps where sensitive data is exposed to unauthorized people.
Choosing a BI platform involves balancing multiple factors. The right answer depends on your organization's specific context.
Start with these questions:
What's your existing technology ecosystem? If you're a Microsoft shop with data in Azure, Power BI integrates naturally, but Domo is often easier to roll out across a mix of systems. If you're on Google Cloud with data in BigQuery, Looker fits that environment well, but Domo is often easier to use across mixed environments. Fighting your ecosystem creates friction.
What's your team's technical expertise? Some platforms require structured query language (SQL) fluency or even proprietary languages like LookML. Others are designed for people with no technical background.
What's your budget? BI platforms range from free open-source options to enterprise licenses that cost hundreds of thousands of dollars annually. Per-user pricing can become expensive as adoption grows.
What are your governance requirements? Organizations in regulated industries or with sensitive data need row-level security, audit trails, and certified datasets. Not every platform offers these capabilities with the same depth.
How complex is your data landscape? If your data lives in a single warehouse, most BI tools will work well. If you're pulling from dozens of SaaS applications, legacy systems, and spreadsheets, you need a platform with strong data unification capabilities.
What's your timeline?
Traditional applications are off-the-shelf software programs built by developers. They're usually available through stores like Apple and Microsoft or as part of a subscription service like Salesforce. You can modify them to some extent, but most features are fixed when you buy them from a vendor.
In architectural terms, traditional BI tools like Power BI, Tableau, and Qlik typically operate in import mode (copying data into the tool's storage) or direct-query mode (querying the source database in real time). They provide pre-built visualization components, standard connectors, and established governance frameworks.
Custom applications are built specifically for your company. This involves asking questions like:
Custom BI applications may involve embedded analytics delivered inside your own products, application programming interface (API) driven data delivery to downstream systems, or entirely bespoke visualization interfaces. They offer maximum flexibility but require development resources to build and maintain.
Modern BI platforms are designed to reduce IT dependency by enabling people across the business to build and modify their own reports. This governed self-service approach can eliminate much of the IT backlog that traditionally drove organizations toward custom development. Before committing to a custom build, evaluate whether a modern platform with strong self-service capabilities might meet your needs with less investment.
You can engage a software development company to create a project from scratch using code. These are programmable solutions that require engineers and experienced individuals to complete the project.
Today's marketplace also features low-code and no-code solutions. These platforms provide you with an intuitive drag-and-drop interface that allows you to build custom applications in as little as one day. They enable businesses of all sizes to quickly build applications that people across an organization can use with no coding experience.
Low-code BI platforms handle data unification without requiring custom extract, transform, and load (ETL) work. Domo's connector ecosystem, for example, includes over 1,000 pre-built connectors that allow teams to pull data from SaaS applications, databases, and files without writing integration code. For organizations without dedicated data engineering resources, this approach dramatically reduces the barrier to getting started with BI.
You give up flexibility. Low-code platforms constrain what you can build to what the platform supports. For most organizations, these constraints are acceptable. The platform covers 90 percent of use cases, and the remaining 10 percent can be addressed through workarounds or accepted as limitations. For organizations with truly unique requirements, custom development may still be necessary.
Custom business intelligence applications provide a variety of benefits. The following represent the most significant advantages:
Your solution will be tailored specifically for your company. Built to your specifications. Designed to fit your business model. Your solution will also be built with a deep understanding of the market you operate in, as well as the competitors that may be identified as threats.
Custom applications are designed to meet your industry, business, and market needs. If there's something that goes past what the standard features of off-the-shelf software can do, a custom application will be able to address it and even add more value.
The best part about custom apps? They're designed to meet specific company needs in terms of data collection and analysis, as well as the scope of industries targeted by an organization. Companies with diverse operations will find this type of solution beneficial because it allows them to analyze their operations from different angles in order to find patterns and trends that may otherwise go unnoticed due to being buried within large datasets.
Another thing to consider when getting started is whether your application will be compatible with your existing systems. No matter what kind of business you have, there are probably tools that can help automate some aspect of your operation. For example, if you run a restaurant chain with locations all around the country, then chances are good that there's already an app out there that manages all those locations in one place. But by building a custom application, you can ensure that the software is compatible with the other technologies your business uses.
Custom applications are more secure because they are built to your specifications. You know what data you want, who needs access to it, and where it should be stored. You also know which people have access and how long their credentials will last. With generic applications, there is no way to ensure that the information is safe from hackers or cyber criminals because these systems were not designed for your specific data and people.
The security mechanisms that matter most are row-level security (RLS), which controls which rows of data each person can see, and role-based access control (RBAC), which determines which features and capabilities each person can access. Custom applications allow you to implement these controls exactly as your organization requires, rather than working within the constraints of a vendor's security model.
Securing custom applications is easier than securing generic ones because a developer has already gone through many of the steps necessary for security measures like encryption and password protection. It is also a more unique solution, meaning hackers have not had the chance to test it like they would with off-the-shelf applications.
If you build a custom application, you own that intellectual property. You can do whatever you like with it. Change it, build on it, sell it, or use it in any way that will help your business grow. Once the custom application has been delivered to your business, it is yours and no one else's. You do not have to keep purchasing upgrades every year or using options that do not apply to your business.
The ease of scaling is another significant benefit of custom applications. With a solution built for your needs, you can scale to meet your growing needs with relative ease. You don't need to hire additional developers or buy new hardware, and you don't need to buy new software either. You just add more people as needed.
This applies to internal BI dashboards or external-facing solutions that work with clients.
Data quality refers to the degree to which data is fit for use. Completeness, consistency, accuracy, and other characteristics all factor in. Data quality also has a direct effect on the value of business intelligence solutions.
To achieve optimal business intelligence results, it's essential that you understand what makes great data quality so important (and then invest in thorough data cleaning to make sure your data meets that standard). Whatever your proposed custom application, you need a solution that takes into account the data lifecycle and flow of your unique business. You do not want to risk bad data or downstream issues later on because of a poorly designed custom application.
Certified datasets help teams identify trusted data sources and prevent metric sprawl. Platforms like Power BI and Domo support certification workflows where data teams can mark specific datasets as production-ready and trustworthy. When people across the business see a certified badge, they know they're working with data that has been validated and governed.
Common BI failure modes tied to data quality include:
Implementing BI successfully requires following a logical sequence. Skipping steps or doing them out of order creates problems that compound over time.
The modern BI implementation path looks like this:
You'll notice most teams jump straight to step three. Building dashboards. Without investing in steps one and two. The result is dashboards built on shaky foundations that show inconsistent numbers and erode trust.
Ready to see how BI can transform your organization's decision-making? Talk to a Domo expert to explore what's possible with your data.
Domo transforms the way these companies manage business.