Join the AI + Data Tour for hands-on training, real customer stories, and time with Domo product experts near you.
Register now

Cloud BI replaces on-premises servers with provider-managed platforms that connect directly to data sources like Snowflake, BigQuery, and Redshift. It delivers real-time insights, reduces IT overhead through subscription pricing, and enables self-service analytics that free teams from report backlogs. This article explains how cloud BI works, compares it to traditional approaches, and walks through the key factors for choosing the right tool.
Here's what you need to know about cloud BI before diving into the details:
BI stands for business intelligence. The practice of turning raw data into actionable insights that help organizations make more informed decisions. Cloud BI takes this process and moves it entirely to cloud-based platforms, so you can analyze your business data online instead of maintaining your own servers.
Think of it this way: cloud BI is the analytics layer that sits on top of your data sources. It is not a data warehouse (where you store data) or a customer relationship management system (CRM) (where you manage customer relationships). It is the tool that helps you understand what all that data actually means.
For IT leaders and data teams managing fragmented analytics tools across departments, cloud BI can serve as a consolidation layer. Instead of finance using one reporting tool, marketing using another, and operations relying on spreadsheets, cloud BI brings everything into a single platform with consistent governance, self-service capabilities, and unified data access.
That consolidation matters for more than convenience. It's often the difference between "we have dashboards" and "we have a single source of truth that finance, sales, marketing, and ops can actually agree on."
Hard to find an organization today that doesn't use at least one cloud-based application. Think customer relationship management (CRM) tools, online collaboration platforms, internet file storage, even help desk software. It makes sense that organizations would want a cloud solution for their business intelligence as well.
The core of business intelligence is turning data into actionable insights. Getting the right insights to the right stakeholders at the right time. The cloud fits naturally here. A fast, scalable way to process, store, deliver, and access data.
For executives and business leaders, the real value comes down to alignment. When finance, sales, marketing, and operations all operate from inconsistent data, comparing metrics or making confident decisions becomes nearly impossible. Cloud BI delivers a single source of truth that connects analytics to measurable business outcomes. Not just timely dashboards, but dashboards that everyone trusts.
Cloud BI only pays off when it works for everyone who touches analytics.
Evaluating whether to move from on-premises BI to the cloud? Or choosing between the two for a new implementation? Understanding the practical differences matters more than marketing claims.
Traditional BI typically involves installing software on local servers, managing your own infrastructure, and relying on IT teams for updates, maintenance, and report generation. Cloud BI shifts all of that to a provider-managed environment where you access analytics through a browser or app.
Here's how they compare across the dimensions that matter most:
The most visible difference is the cost model. Traditional BI requires significant capital expenditure upfront: servers, storage, networking equipment, software licenses, and the physical space to house it all. Cloud BI operates on a subscription model where you pay monthly or annually based on usage.
But the capital expenditure (CapEx) vs. operating expenditure (OpEx) framing only tells part of the story.
Cloud BI introduces cost variables that traditional BI doesn't have, and understanding them helps you avoid surprises:
A realistic total cost of ownership (TCO) comparison should account for these variables alongside the obvious savings from eliminating hardware and reducing IT overhead. Many organizations underestimate query costs in particular. A dashboard that runs expensive queries every time it loads can quietly inflate your monthly bill.
Traditional BI deployments often take months. You need to procure hardware, configure networks, install software, set up security, and train people. All before anyone sees their first dashboard.
Cloud BI compresses this timeline dramatically. Most platforms can be operational within days or weeks because the infrastructure already exists. Your team focuses on connecting data sources, building dashboards, and configuring access rather than managing servers.
For organizations with legacy on-premises systems that can't move to the cloud immediately, most cloud BI platforms support a gateway pattern. A lightweight agent installed in your environment securely connects on-premises databases to the cloud BI platform, letting you analyze data from both worlds without a full migration.
Maintenance follows a similar pattern. With traditional BI, your IT team handles software updates, security patches, performance tuning, and capacity planning. With cloud BI, the provider manages infrastructure-level maintenance while you focus on the analytics layer: data models, dashboards, and access for people.
Traditional BI often creates access friction. People may need virtual private network (VPN) connections, specific software installed, or physical presence in the office to view reports. Sharing insights typically means exporting files, which creates version control headaches and stale data.
Cloud BI is browser-based by design. Anyone with appropriate permissions can access dashboards from any device, anywhere. Teams share live dashboards rather than static exports, so everyone works from the same current data. Comments, annotations, and alerts happen within the platform rather than through separate email threads.
Cloud BI works well for most organizations, but it's not universally the best choice. Here are scenarios where on-premises or hybrid approaches may make more sense:
For many of these scenarios, a hybrid approach (keeping sensitive or latency-critical workloads on-premises while using cloud BI for broader analytics) offers a practical middle ground.
To understand how cloud BI works, it helps to visualize the data flow from source to insight. While specific implementations vary by platform, most cloud BI architectures follow a similar pattern:
Data sources → Ingestion/extract, load, transform (ELT) → Cloud warehouse or data lake → Semantic layer → BI platform → Dashboards and alerts
Each layer serves a distinct purpose. Understanding where vendor responsibilities end and customer responsibilities begin helps you plan implementation effectively.
The architecture breaks down into several key components:
The data source layer includes everything generating data your organization wants to analyze. Software as a service (SaaS) applications like Salesforce or HubSpot, databases, spreadsheets, application programming interfaces (APIs), and streaming data from internet of things (IoT) devices or event systems.
The ingestion layer moves data from sources into your analytics environment. This is where ELT (extract, load, transform) or ETL (extract, transform, load) tools operate. The distinction matters: ETL transforms data before loading it into the warehouse, while ELT loads raw data first and transforms it within the warehouse. Modern cloud architectures typically favor ELT because cloud warehouses handle transformation efficiently at scale.
The storage layer, usually a cloud data warehouse like Snowflake, BigQuery, or Amazon Redshift, or a data lake for less structured data, holds your consolidated data. This is where cleaning, deduplication, and joining data from different systems happens.
The semantic layer (covered in detail below) sits between raw data and the BI tool, providing consistent metric definitions and business logic.
The BI platform layer is where visualization, dashboards, and reporting happen. This is the interface most people interact with.
At each layer, responsibilities split between vendor and customer. The cloud provider typically manages infrastructure, uptime, security patches, and scaling. You manage data modeling, metric definitions, access for people, and dashboard design.
One of the most important components of cloud BI architecture is the semantic layer. And honestly, it's the part most implementation guides skip over entirely. This is the translation layer between raw data and business meaning.
Without a semantic layer, different teams often create their own definitions for the same metrics. Marketing calculates "active customers" one way, sales calculates it another, and finance uses a third definition. Dashboards proliferate, but nobody trusts the numbers because they don't match.
A semantic layer solves this by centralizing metric definitions. "Net Revenue," "Active Customer," "Churn Rate," each gets a single, governed definition that every dashboard references. When the definition needs to change, you update it once, and every report reflects the new logic.
In practice, this works through a centralized metrics store or modeling layer. Tools like dbt, LookML, or platform-native semantic layers let you define calculations, relationships, and business logic in one place. Version control tracks changes. Data stewards own specific metrics. The result is that a store manager checking daily sales and a chief financial officer (CFO) reviewing quarterly performance are looking at numbers calculated the same way.
Governance is not only about consistency. It is also about confidence for non-technical teams: clearly governed metrics, combined with controls like row-level security, help people know the number is trusted and that they're seeing the right slice of it.
A public cloud is an affordable cloud BI option because, in a public cloud, the cost of infrastructure is split among several cloud tenants.
A private cloud works for organizations that have to be cognizant of data security and regulatory compliance. It is the most expensive of the three cloud options, but it offers dedicated storage and computing resources.
Some organizations take a hybrid approach to the cloud. They may have certain data that is subject to strict regulations and other data that isn't. A hybrid option allows them to store and analyze their most sensitive data in a private cloud and work with the rest of their data in a public cloud.
Trying to picture how this comes together in the real world? The rollout usually looks like a mix of technical setup and adoption work.
Most teams start with a few high-value data sources, publish a first set of governed metrics, and then expand access in waves:
The value of cloud BI depends heavily on what it can connect to. A platform that can't access your data sources isn't useful, no matter how polished its dashboards look.
Modern cloud BI platforms typically offer hundreds of pre-built connectors spanning several categories:
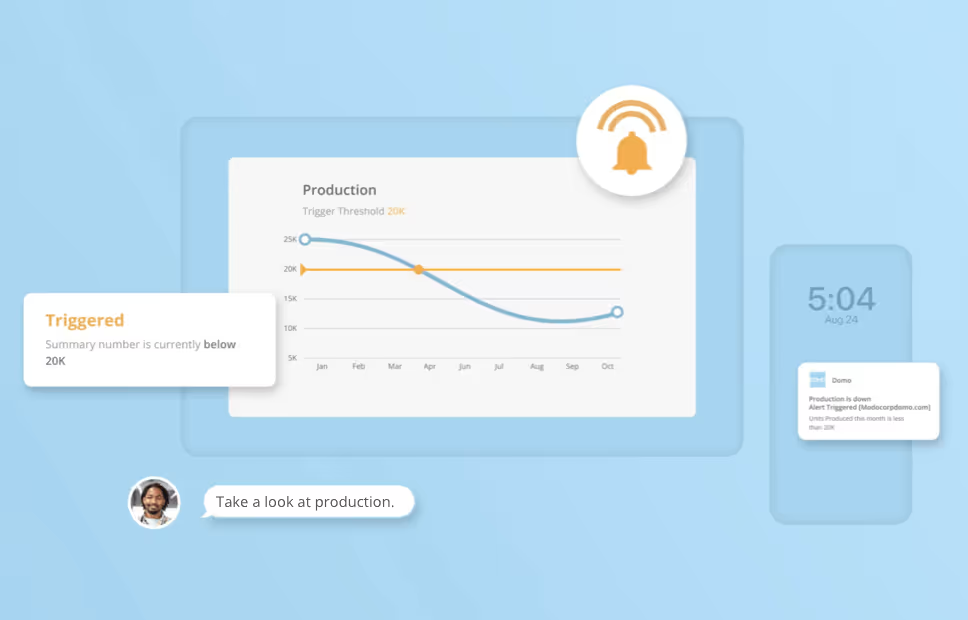
Beyond just connecting, integration capabilities should include automated refresh (both scheduled and incremental), so dashboards stay current without manual intervention. Threshold-based alerting lets you trigger notifications when metrics cross defined boundaries. A sales pipeline drops below target. Inventory falls to reorder levels. Website errors spike.
Some cloud BI platforms, including Domo, support 1,000+ data source connectors, which can make a big difference when you're trying to reduce tool sprawl instead of adding yet another "special case" pipeline to your backlog.
For data engineers managing diverse and siloed source systems, connector breadth directly impacts pipeline reliability. Every source that requires custom integration work is a maintenance burden. Another pipeline to monitor, another potential point of failure.
When evaluating cloud BI platforms, look beyond the connector count to understand:
The goal is automated ingestion at scale without requiring custom pipeline maintenance for every new data source. Platforms with clear APIs for custom integrations and automation features (like scheduled ingest and transformation workflows) reduce the operational burden on data teams.
Traditional desktop BI often leads to version control issues, data silos, and IT bottlenecks. Cloud BI eliminates these roadblocks while delivering additional advantages.
Before diving into specific benefits, clarifying what "real-time" actually means in cloud BI contexts matters. The term gets used loosely, but there are meaningful distinctions:
The right tier depends on your use case. Stock trading dashboards need streaming data. Weekly sales reports work fine with daily refreshes.
By centralizing data from multiple sources in the cloud, organizations can break down silos and gain a holistic, 360-degree view of the business. This makes it easier to uncover trends and spot opportunities across the entire organization.
Cloud BI processes and updates data continuously, so dashboards and reports reflect what's happening right now. Leaders and teams can respond quickly to market shifts and operational changes.
For organizations that need true real-time capabilities, several technical requirements must be in place:
Without these foundations, "real-time" becomes a marketing term rather than an operational reality.
With data and dashboards hosted in the cloud, teams can securely share insights across departments, locations, and even with external partners. Everyone works from the same source of truth, which improves alignment and teamwork.
Because your cloud provider manages infrastructure, maintenance, and software updates, IT teams spend less time on routine requests and more time on strategic initiatives. Business people also benefit from self-service analytics, reducing their reliance on IT for reports.
For BI managers, this shift is significant. When business people can answer their own questions through self-service dashboards, analysts can redirect their time from reactive report delivery to proactive strategic analysis. The goal isn't just fewer tickets. It's freeing skilled analysts to work on problems that actually require their expertise.
Cloud BI eliminates the need for expensive on-premises servers and reduces IT overhead. With a subscription-based model, organizations can scale up or down as needed, paying only for the resources they use.
Since cloud BI is internet-based, stakeholders can access insights from anywhere, on any device. Whether you're in the office or working remotely, your data and dashboards are always within reach.
Cloud BI applies across industries because it puts real-time insights into the hands of more people. The most effective implementations tie analytics directly to measurable business outcomes. Not just clearer visibility but specific key performance indicators (KPIs) that improve as a result.
Cloud BI enables self-service BI, allowing employees to create and access their own reports and dashboards without waiting on IT. This reduces reporting backlogs and helps teams get the answers they need sooner.
Organizations that implement self-service effectively often see report request volumes drop by 40-60 percent as business people become self-sufficient for routine questions.
With cloud BI, companies can combine marketing, sales, and customer service data into a single view. This helps teams uncover customer behavior trends, improve marketing analytics, and deliver more personalized experiences that drive loyalty.
A retailer might track customer lifetime value by segment, identifying which acquisition channels produce the most valuable long-term customers, then shift marketing spend accordingly.
Businesses use cloud BI to monitor supply chains, staffing, and analytics reporting tools in real time. By identifying bottlenecks or inefficiencies, they can take action quickly and reduce costs.
A distribution company tracking delivery times by route and driver can identify patterns that add hours to deliveries, then adjust routing or schedules to cut costs and improve customer satisfaction.
When paired with AI data analysis, cloud BI goes beyond describing what happened. It can predict future outcomes and recommend next steps. This makes forecasting and scenario planning more accurate.
Cloud BI platforms deliver interactive data visualizations that update instantly as new data flows in. Decision-makers can spot trends, drill down into details, and act in the moment.
A lot of cloud BI value shows up in the day-to-day. Managers and frontline teams don't need 47 tabs and a training course. They need clear KPIs, in context, with confidence that the numbers are real.
For example, a sales manager might want a view that sticks to pipeline coverage, conversion rates, and rep activity. A store manager might want inventory risk, staffing coverage, and yesterday's sales against target. When the platform supports customization and governed metrics, teams get independence without creating metric chaos.
Some platforms, including Domo, also offer AI chat and natural language querying so people can ask questions in plain language and get governed answers quickly. AI doesn't need to feel like a riddle wrapped in a mystery.
Cloud BI applies across industries, but how it's used varies by role and context:
In retail, a store manager might check a mobile dashboard each morning showing yesterday's sales against target, current inventory levels for fast-moving items, and staffing efficiency metrics. A merchandising executive at the same company uses cloud BI to analyze sell-through rates by stock keeping unit (SKU) across regions, identifying which products to promote or discontinue.
In healthcare, a hospital administrator tracks bed utilization, patient wait times, and staffing ratios to optimize operations. A clinical researcher at the same institution uses cloud BI to analyze patient outcome data across treatment protocols, identifying patterns that inform care decisions.
In financial services, a branch manager monitors daily transaction volumes and customer satisfaction scores. A chief financial officer (CFO) uses the same platform to track cash flow forecasts, compare actuals against budget across business units, and model scenarios for board presentations.
Ready to move your business intelligence to the cloud? More options arrive on the market every day. Before evaluating specific vendors, it helps to understand the categories of tools available:
The right category depends on your needs. If you need rich visualizations and self-service for business people across multiple data sources, BI layer tools are typically the best fit. If your team is structured query language (SQL)-proficient and you want to minimize data movement, warehouse-native options may work well. Building analytics into a software as a service (SaaS) product? Embedded analytics platforms are designed for that use case.
Within any category, several capabilities matter most:
Your cloud BI tool should have the capability to extract data from multiple sources, cleanse it for high-quality results, and transform it into a usable format. In business intelligence, the basics of data integration are crucial.
Beyond initial connectivity, evaluate how the platform handles ongoing data management:
Advanced analytics capabilities like data mining and effective root-cause analysis are going to become more common needs across industries. Cloud BI tools should be prepared to deliver.
Look for platforms that support statistical analysis, predictive modeling, and integration with machine learning workflows, either natively or through connections to specialized tools.
Generating rich reports and clear, eye-catching visuals helps every person, no matter their analytics background, understand the data insights they receive so they can put them to good use.
The more organizations can share relevant information across departments and teams, the more the entire business can benefit from data insights and move forward together with a unified goal in sight. Your cloud BI tool should allow you to easily share analytics.
Self-service only scales when governance scales with it. If your platform makes it easy to create dashboards but hard to standardize metrics, you'll end up with a lot of activity and not a lot of agreement.
As you evaluate tools, look for:
For enterprise IT leaders, security is not just a feature checkbox. It is a governance requirement that must scale across a multi-team, self-service environment without creating access bottlenecks.
When evaluating cloud BI platforms, work through this checklist:
Cloud BI pricing models vary significantly. The right model depends on your usage patterns:
Beyond the licensing model, consider total cost of ownership variables:
A platform that looks inexpensive per-seat may become costly if it drives heavy warehouse compute charges.
Cloud BI delivers significant benefits, but successful implementation requires navigating several challenges:
For IT leaders managing governance across distributed teams, the biggest risk is often metric inconsistency. When self-service analytics scales without proper governance, different teams create conflicting definitions for the same metrics. Finance calculates revenue one way, sales another, and executive dashboards show numbers that don't reconcile. A semantic layer and clear data governance processes help prevent this drift.
For BI managers, the challenge is often adoption. A powerful platform that nobody uses delivers no value. Change management, training, and demonstrating quick wins matter as much as technical capabilities.
Choosing a cloud BI platform is a significant commitment. Switching costs are real. Dashboards, data models, training for people, and integrations all need to be rebuilt if you change platforms.
When evaluating vendors, consider:
There's no way to eliminate lock-in risk entirely, but understanding where the dependencies lie helps you make informed decisions.
Cloud BI is quickly becoming the default approach to analytics, thanks to its flexibility and scalability. As organizations grow, cloud BI platforms will expand right alongside them.
Looking ahead, here are some trends shaping the future of cloud BI:
You'll notice a pattern here. The future isn't just about improved technology. It is about making that technology disappear into the workflow.