Nehmen Sie an der AI + Data Tour teil und profitieren Sie von praktischen Schulungen, echten Kundengeschichten und dem Austausch mit Domo-Produktexperten in Ihrer Nähe.
Jetzt registrieren
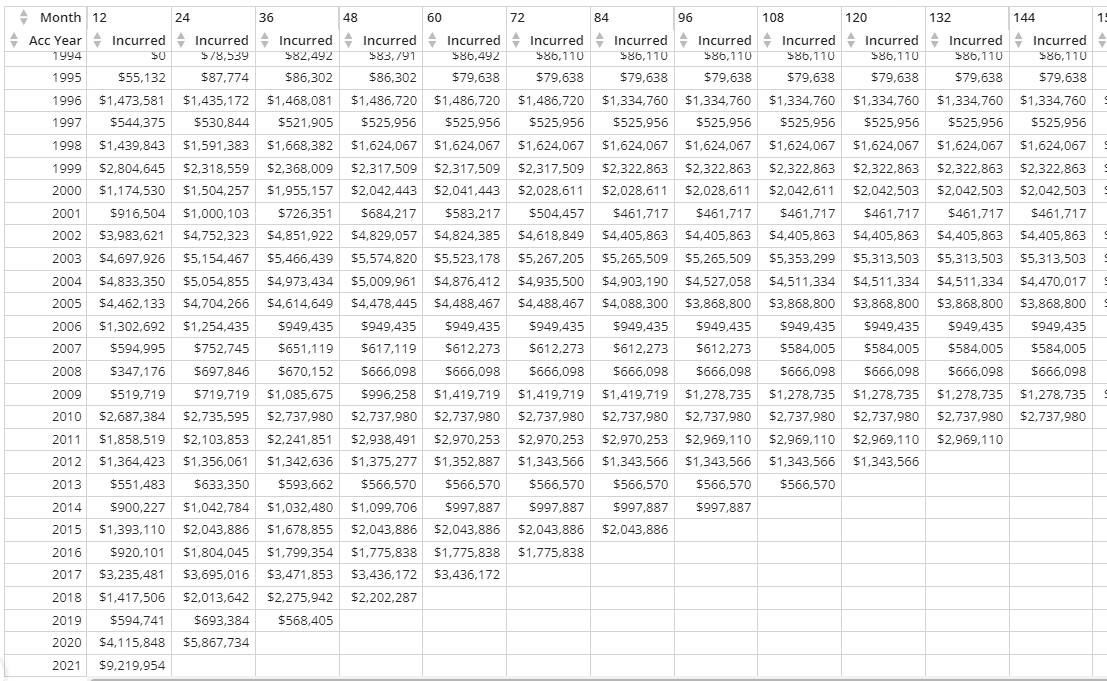
A critical need for any insurance company is the ability to track claim losses over time by displaying them in what are called “loss triangles.”
Typically, this is a very manual process that involves looking at financial transactions over the last year, identifying when the claims occurred, and updating an Excel spreadsheet accordingly.
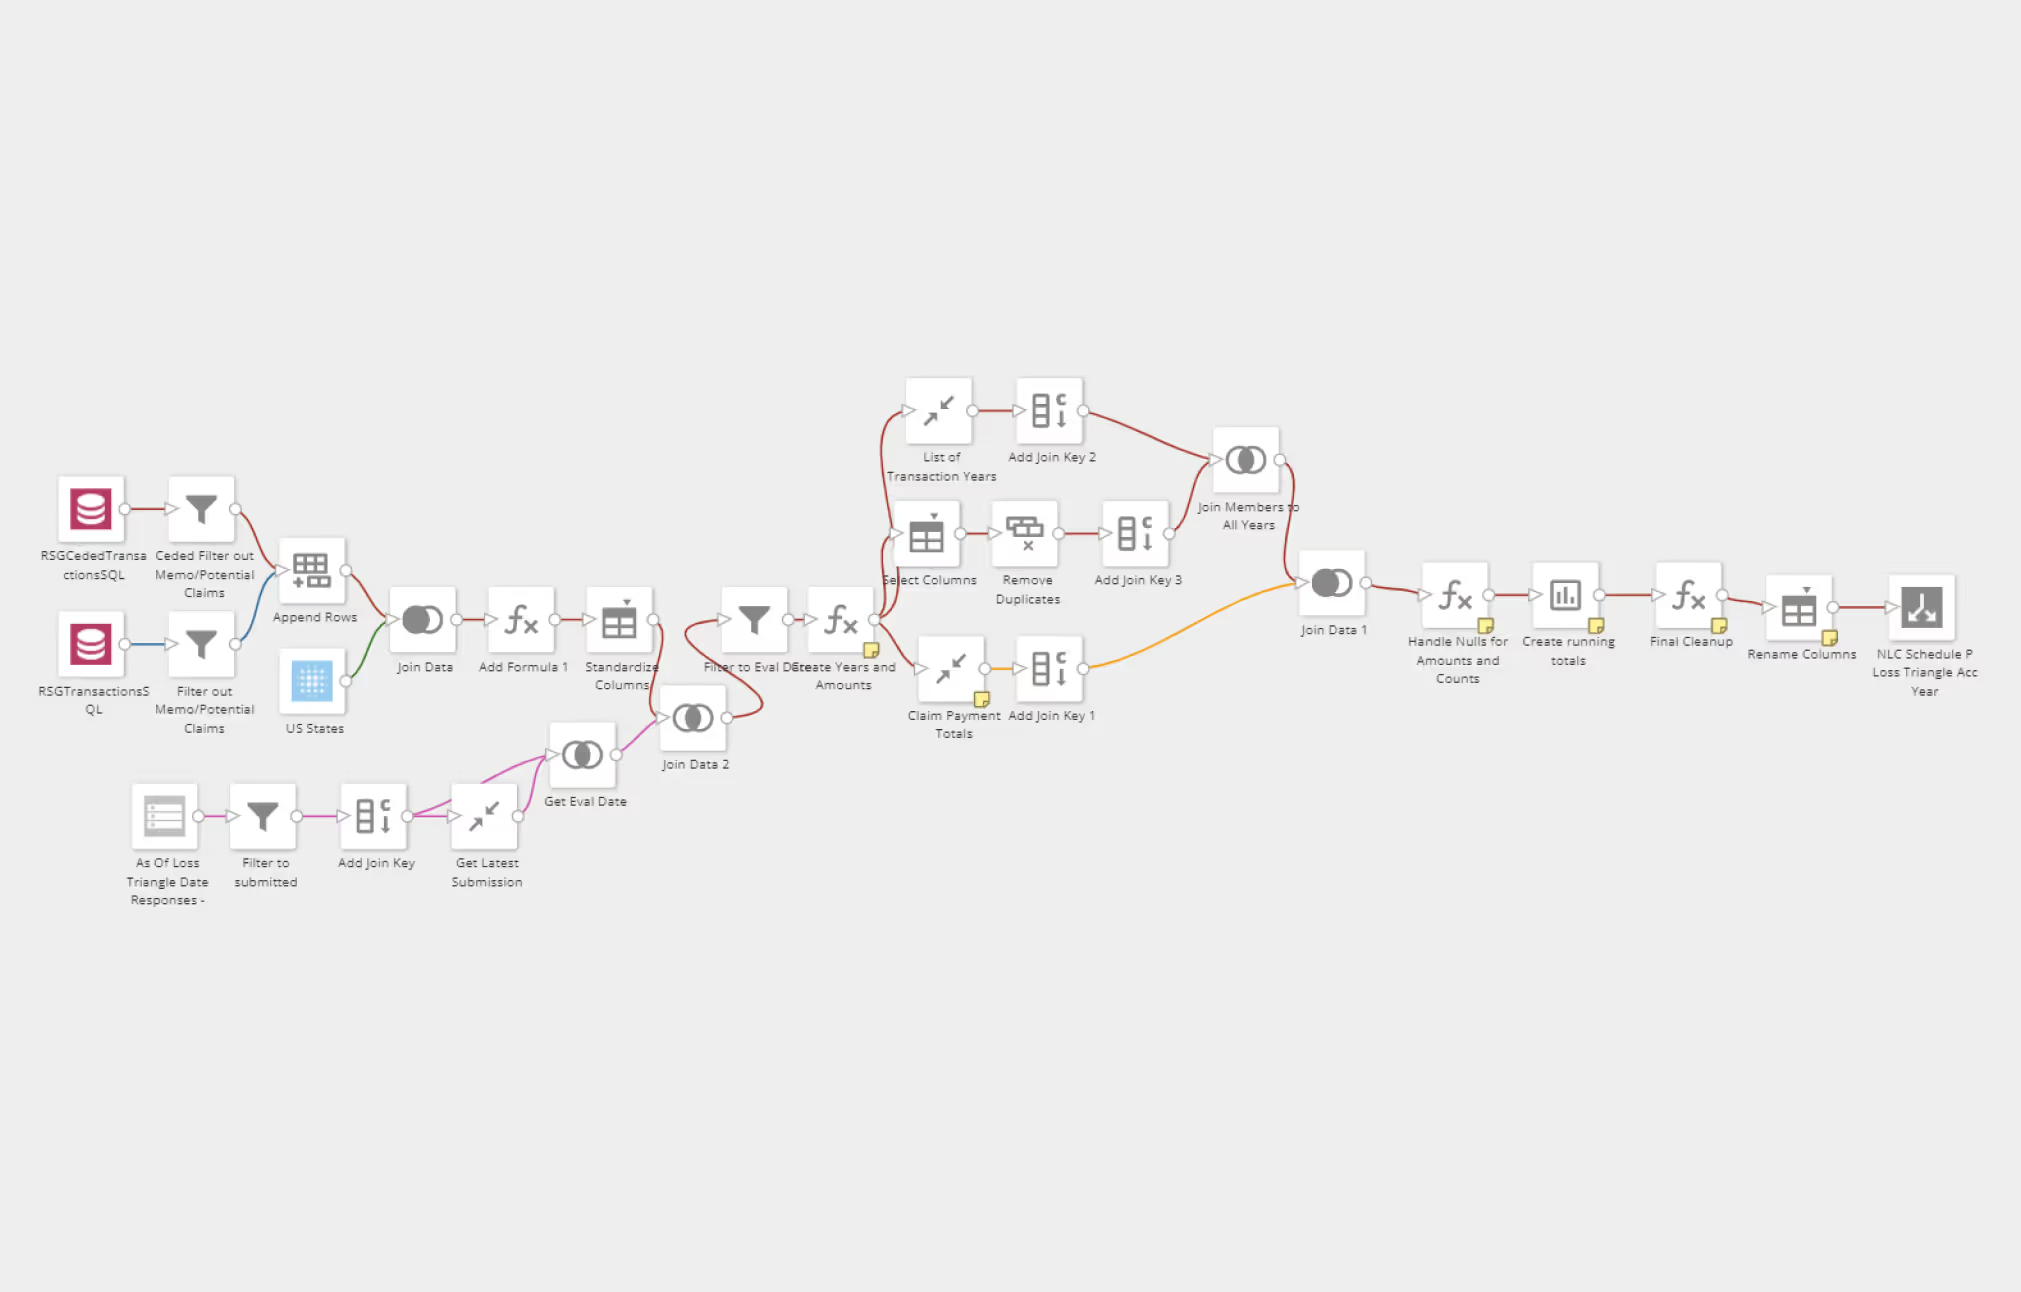
By leveraging Magic ETL and using the pivot table card, I have been able to automate this process and allow members of our finance team to view updated triangles any time they want.
I enhanced it even further by using Form Builder, which allows the user to select a specific evaluation date in case they don’t want the most recent date but do want to look at a certain historical date.
This saves our company countless hours each month and also improves accuracy.
To produce the loss triangles, I leverage the group by tile and the rank and window tiles to create running totals. This allows me to show losses for each year of a claim.
I then use the pivot table card and place the loss year in the row, the transaction year (or months of development) in the columns, and the amount in the value field. This results in the information being displayed in the shape of a triangle: