Join the AI + Data Tour for hands-on training, real customer stories, and time with Domo product experts near you.
Register now

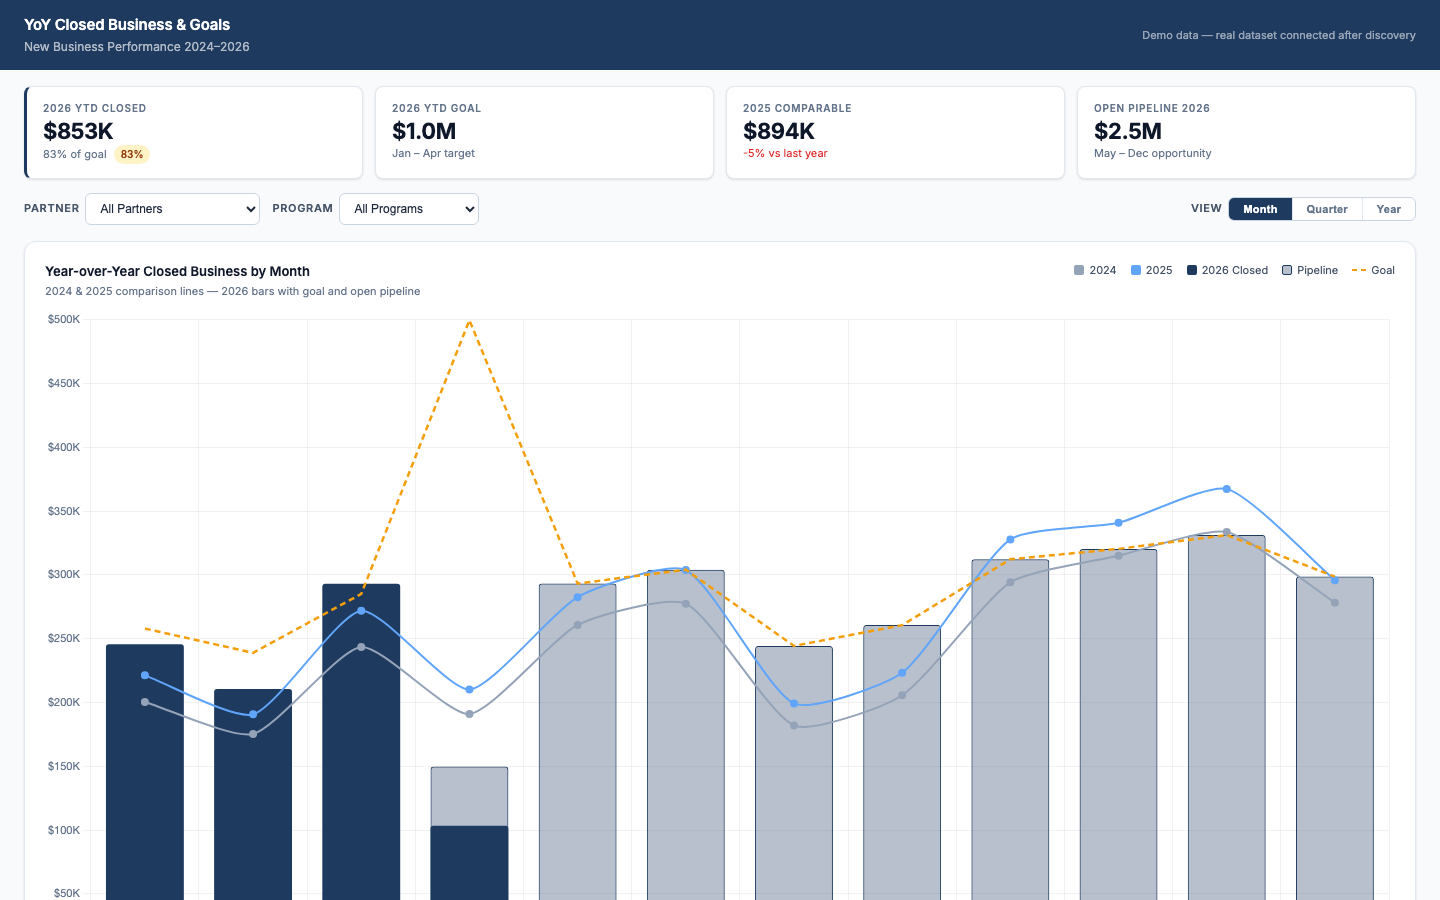
## The problemYear-over-year sales charts in most BI tools quietly mislead leaders. Goal lines float over the wrong year's bars. Open pipeline cannot be stacked onto current-year closed business. Every leadership review starts with the same argument about what the chart actually means.## What this app doesA single visualization shows three years of closed business side-by-side by month, with the current-year goal line correctly aligned to the current-year bar group and a visually distinct open-pipeline segment stacked on top. Filters by partner and program isolate any book of business. Hover detail surfaces gross premium and enrolled count. The view defaults to the current year on load — no clicks to orient.## Key takeaways- Goal line that always tracks the right year- Open pipeline overlay for forward-looking forecast- Three-year monthly history without spreadsheet pulls- Partner and program filters for any book of business## Who it's forExecutives, sales leaders, and revenue operations teams in insurance and brokerage who need a single trusted source of truth for pre-meeting prep.


