Hai risparmiato centinaia di ore di processi manuali per la previsione del numero di visualizzazioni del gioco utilizzando il motore di flusso di dati automatizzato di Domo.
Guarda il video


Self-service reporting gives non-technical employees the power to answer their own data questions, build visualizations, and share insights without waiting on IT. This guide covers how self-service reporting works, what features to look for in a tool, and how to implement it successfully while maintaining strong data governance.
Here are the main points to keep in mind:
A fundamental shift is happening in how organizations interact with their data. Self-service reporting puts the tools directly in the hands of business people. No more submitting requests to IT. No more waiting days or weeks for answers. People explore data, build reports, and share insights on their own timeline.
Why does this matter?
The pace of business decisions has accelerated dramatically. When a marketing manager needs to understand which campaigns drove the most pipeline last quarter, or a regional sales director wants to compare territory performance, waiting for IT to queue and fulfill that request creates a bottleneck that slows the entire organization.
Self-service reporting removes that bottleneck by giving business people direct access to governed data through intuitive tools. IT still plays a critical role (setting up the infrastructure, defining security policies, and maintaining data quality) but the day-to-day work of building reports shifts to the people closest to those questions.
Let's be clear about what self-service reporting is not. Dashboards are designed for monitoring; they display key metrics in real time so you can spot trends or anomalies at a glance. Ad hoc analysis is exploratory, involving open-ended investigation to answer questions you didn't know you had. Self-service reporting sits between these: it produces standardized, repeatable outputs that answer specific business questions and can be shared, scheduled, and refreshed automatically.
Understanding the mechanics helps clarify why self-service reporting delivers faster time-to-insight than traditional approaches.
Consider a practical example. A marketing manager wants to answer the question: "Which campaigns drove the most pipeline last quarter?"
In a traditional BI environment, this question becomes a ticket. The marketing manager submits a request to IT or the analytics team, describes what they need, and waits. Days or weeks later, they receive a report. If it doesn't quite answer the question, the cycle starts again.
With self-service reporting, the workflow looks different.
The marketing manager opens the reporting tool and connects to a governed dataset that contains campaign performance data. They select the dimensions they need (campaign name, channel, date) and the measures that matter (pipeline generated, conversion rate, cost per lead). They apply a filter for the last quarter, choose a visualization type, and within minutes have a report they can share with their team or schedule to refresh automatically.
Speed isn't the only difference here. It's iteration. If the first report raises a follow-up question ("How does performance vary by region?"), the marketing manager can answer it immediately rather than submitting another request. This rapid iteration cycle is where self-service reporting creates the most value. Each question answered often surfaces two more worth exploring.
Self-service reporting doesn't eliminate IT's role. It transforms it. The most successful implementations follow a hybrid governance model where IT and data engineering own the governed foundation while departmental people build and share reports within those guardrails.
IT's responsibilities in this model include maintaining the data infrastructure, defining the semantic layer (the shared set of metric definitions and business logic), configuring security and access controls, and certifying datasets for self-service use. Departmental people then work within this governed environment, confident that the data they're using is accurate, consistent, and appropriate for their role.
This separation of concerns is what makes self-service reporting sustainable at scale.
Traditional BI refers to the long-standing process of gathering, analyzing, and reporting on business data using a centralized data warehouse and IT-driven processes. Self-service reporting takes a more modern approach. It allows everyone, regardless of their role or technical skill, to access and analyze data without help.
The shift from traditional BI to self-service reporting represents a move from centralized control to distributed autonomy within governance guardrails.
Until recently, only large, technically savvy companies could access data insights and use them to increase their competitive advantage. Now, thanks to self-service reporting and analytics, companies of any size can empower their employees to put business and customer data to work.
Self-service reporting allows employees to ask and answer their own questions on the fly, without having to wait on busy IT teams. The intuitive nature of self-service reporting tools enables those with no technical knowledge to create the data reports and visualizations needed to answer business questions. Over time, these people develop stronger analytical skills and become citizen data scientists (employees who can perform sophisticated analysis without formal data science training).
Self-service reporting tools provide instant access to company or customer data within the governance guardrails that the IT team sets up. This allows employees to create reports or dashboards more quickly. Organizations that implement self-service reporting often see time-to-insight drop from days or weeks to minutes. That shift compounds across hundreds of decisions each quarter.
Each team can use self-service tools to customize data reports to their exact needs. This also provides a deeper understanding of data and company performance. A sales team might slice pipeline data by territory and product line, while finance examines the same underlying data by cost center and time period.
Most modern self-service reporting tools provide advanced AI-powered insights that clean and verify data during the gathering process. This assures people are only viewing and reporting on up-to-date, error-free information. However, AI validation does not replace human judgment. Teams should still review outputs for logical consistency, especially when results will inform major decisions.
Internal employees are not the only ones who can benefit from self-service reporting tools. Your team can make these tools available to customers so they can resolve their own issues, or at least get started before contacting support. Customers will feel more satisfied, and your organization can improve satisfaction metrics.
With the entire organization making better, more informed decisions, revenue and ROI stand to increase. Self-service reporting also frees up data engineers and analysts to focus on complex, strategic work rather than fielding routine report requests.
Self-service reporting delivers significant benefits, but implementations can stumble without proper planning.
Here's the most common failure mode: metric drift. It happens when different teams calculate the same metric differently. Marketing defines "customer acquisition cost" one way, finance defines it another, and suddenly leadership is looking at two reports with conflicting numbers and no way to know which is correct.
This happens when organizations skip the semantic layer, a shared set of metric definitions that sits between raw data and the reporting tool. Think of the semantic layer as a translation layer that converts raw database fields into business-friendly terms everyone agrees on. When "revenue" is defined once in the semantic layer, every report pulls from that same definition.
Without a semantic layer, you get the "spreadmart" problem: every team exports data to Excel, applies their own calculations, and creates their own version of the truth. The solution is to invest in metric governance before rolling out self-service access. Define your core metrics (revenue, churn, conversion rate, customer lifetime value) with clear calculation logic, document them in a business glossary, and ensure all reports pull from these certified definitions.
And honestly, this is the part most guides skip over: defining metrics in the semantic layer but allowing report creators to override calculations at the report level defeats the entire purpose. Lock down core metric logic to prevent well-intentioned modifications from reintroducing inconsistency.
Some organizations use dataset certification tiers (bronze, silver, and gold) to signal trust levels. The data team has validated the gold dataset and approved it for executive reporting. A bronze dataset is exploratory and should be used with caution.
Dashboard sprawl is the natural consequence of successful self-service adoption. Give people the power to create reports, and they will create reports. Sometimes hundreds of them. Without lifecycle management, you end up with a graveyard of stale dashboards that no one uses but everyone is afraid to delete.
The solution is a certification and archiving process. Distinguish between official reports (certified by the data team, approved for broad use), departmental reports (owned by a specific team, appropriate for their context), and experimental reports (exploratory work that may or may not prove useful).
Establish a practical hygiene standard: reports or dashboards that have not been viewed in approximately 90 days should be reviewed for archiving or deletion. This threshold gives teams enough time to identify seasonal reports that may only be relevant quarterly while still catching truly abandoned content.
A sandbox-to-certified promotion workflow helps here. New reports start in a sandbox environment where creators can iterate freely. When a report proves valuable, it goes through a certification process.
Self-service reporting means more people accessing more data. Legitimate security concerns follow. The solution is not to restrict access broadly (that defeats the purpose) but to implement granular controls that give people access to exactly what they need.
Role-based access control (RBAC) is the baseline. Define roles (sales rep, regional manager, executive) and assign permissions based on what each role needs to do their job. But RBAC alone is not enough for sensitive data.
Row-level security (RLS) adds another layer. With RLS, a regional sales manager sees only their territory's data, not the full dataset. The underlying report is the same, but the data is filtered based on who is viewing it. This allows you to build one report that serves multiple audiences without exposing data inappropriately.
For personally identifiable information (PII), column-level security or data masking handles the edge cases. A customer service rep might need to see account details but not social security numbers. Masking hides sensitive fields while preserving access to everything else.
User access policies and compliance with appropriate regulations are essential components of any self-service implementation.
The biggest risk to self-service reporting is not technical failure. It's adoption failure. You can build the perfect infrastructure, but if people do not use it, you have wasted your investment.
Resistance typically comes from two sources: people who are comfortable with the old way of doing things, and people who tried self-service tools before and had a bad experience. Both require deliberate change management.
A Center of Excellence (CoE) or governance committee is the organizational mechanism that sustains adoption over time. This is not just an initial training program. It is an ongoing team that owns standards, runs office hours, maintains documentation, and manages the community of practice. The CoE becomes the go-to resource for questions, the arbiter of best practices, and the champion for self-service adoption across the organization.
Training should be persona-based, not one-size-fits-all. Data consumers need to learn how to read and filter certified reports. Report creators need to learn how to build from certified datasets. Data stewards need to learn how to manage access and certify content. And all training should cover data interpretation (not just tool mechanics) to avoid "analytically wrong" conclusions where people use the tool correctly but misunderstand what the numbers mean.
Not all self-service reporting tools are created equal.
A self-service reporting tool is only as useful as the data it can access. Look for broad connectivity to your existing data sources: cloud data warehouses, databases, software-as-a-service (SaaS) applications, spreadsheets, and application programming interfaces (APIs). The goal is a single platform where people can access all the data they need without switching between tools.
The semantic layer is the most critical component for sustainable self-service reporting. It is also the one most often overlooked in feature comparisons. A semantic layer translates raw data into business-friendly terms (dimensions, measures, key performance indicators, or KPIs) so every person is working from the same definitions.
Without a semantic layer, you are asking business people to understand database schemas and write their own calculations. That's a recipe for inconsistent metrics and eroded trust. With a semantic layer, the complexity is abstracted away. A marketing manager selects "Customer Acquisition Cost" from a dropdown, and the tool applies the correct calculation automatically.
Look for tools that support metric naming conventions, versioning (so you can track how definitions change over time), and a business glossary where people can look up what each metric means and how it's calculated.
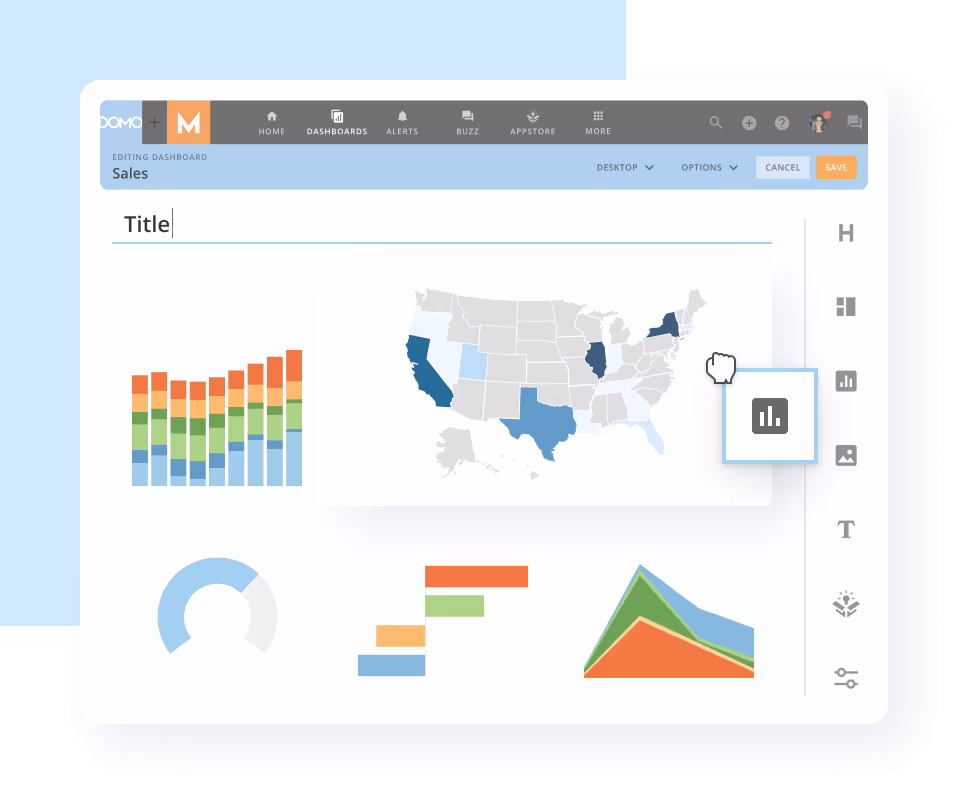
The interface matters. Self-service reporting tools should offer drag-and-drop report building, a variety of chart types appropriate for different data stories, and interactive features like filtering, drilling, and cross-filtering.
Business intelligence dashboards should support both monitoring (real-time views of key metrics) and analysis (the ability to dig deeper when something looks off).
Data insights are only valuable if they reach the people who need them. Look for tools that support sharing reports via links, embedding visualizations in other applications, scheduling automated report delivery, and commenting or annotating directly on reports.
Embedded analytics capabilities are particularly valuable if you want to surface insights within the applications your teams already use.
As self-service adoption scales, people need a way to distinguish official reports from experimental ones. Look for tools that support certification workflows, the ability to mark a dataset or report as certified so people know whether they can rely on it for decision-making.
Trust labels (official vs departmental vs experimental) help people navigate a growing library of reports and find the ones that have been validated by the data team.
Self-service reporting empowers employees across your organization to proactively ask and answer questions that are backed by data. Building these habits can result in higher productivity, fewer errors, increased customer retention and satisfaction rates, and so much more.
To realize these benefits, your team needs to implement the tool successfully in your existing reporting environment.
Before people can self-serve, the data team needs to establish a governed layer that sits between raw source data and the report builder. This is what separates a successful rollout from "wild west" analytics.
The foundation includes a centralized data repository where people can view the most up-to-date information and collaborate on it with fellow colleagues. Rather than sending people to multiple places to report on data, create a centralized data repository. This decreases the likelihood of errors or misinformation being shared. Additionally, a single data repository makes it easier for higher-ups to monitor who is accessing what data and when.
The target-state architecture typically includes raw data (as it arrives from source systems), curated and conformed data (cleaned and standardized), a certified semantic layer (business-friendly metric definitions), a self-service sandbox (where people can explore and build), and certified reports (validated outputs approved for broad use).
Your organization is likely storing sensitive or confidential data that is not meant for all business people. Implement user access policies to protect this data. These policies determine who has access to what data down to a granular level, ensuring only authorized people are viewing and reporting on data.
The "managed self-service" model (where IT governs the data model and business people own reporting within those guardrails) is the industry-standard approach. Microsoft's Power BI documentation is a useful reference point for this pattern, but some teams need a more unified governance and reporting experience, which is where Domo can stand out.
Configure role-based access control, row-level security for sensitive datasets, and certification workflows for promoting content from sandbox to official status.
Your employees may feel wary of yet another tool. Some may not use a new tool at all if they do not understand the importance behind it. Take the time to provide training on using the tool and ongoing support after implementation.
Training should be persona-based, not one-size-fits-all. Consider three tracks: data consumers (how to read and filter certified reports), report creators (how to build from certified datasets), and data stewards (how to manage access and certify content).
Training should cover data interpretation, not just tool mechanics. People need to understand what the numbers mean, how filters affect results, and how to recognize when something might be misleading. I've seen too many implementations where teams were trained on how to build reports without ever being taught how to validate that their output makes sense. Include exercises where learners identify flawed analyses, not just create new ones.
Start with a pilot. One or two departments with clear use cases and motivated champions. Measure success (adoption rates, time-to-insight, reduction in IT requests) and use those wins to build momentum for broader rollout.
The biggest drawback to traditional business reporting systems is they are not efficient enough to report on the latest company data. Instead, they pull in data that may be days, weeks, months, or even years old. Self-service tools ensure only the latest data is utilized, maintaining decision credibility and trustworthiness.
As adoption scales, implement content lifecycle management. Reports or dashboards that have not been viewed in approximately 90 days should be reviewed for archiving or deletion.
Proving the value of self-service reporting requires tracking the right metrics. Structure your measurement framework around three categories.
Adoption metrics tell you whether people are actually using the tools. Track active people in the platform (how many people log in and run queries each week), the percentage of reports built on certified datasets (vs uncertified or ad hoc sources), and the reduction in IT report requests over time. A healthy target is 80 percent of business people running at least one query per week within six months of rollout. This threshold indicates the tool has become part of daily workflow rather than an occasional resource.
Efficiency metrics tell you whether self-service is delivering on its promise of faster insights. Track time-to-insight (how long it takes from question to answer), report creation time (how long it takes to build a new report), and the backlog of pending analytics requests. Organizations that implement self-service reporting well often see time-to-insight drop from five days to five minutes.
Trust metrics tell you whether people believe the data they're seeing. Track data quality scores, confidence surveys from people, and metric consistency audits (how often different reports show conflicting numbers for the same metric). A reduction in "which number is right?" conversations is a strong signal that your semantic layer and governance are working.
Evaluating self-service reporting tools requires looking beyond feature checklists.
Ease of use by persona matters because different people have different needs. Executives need at-a-glance dashboards they can consume on mobile. Managers need the ability to filter and drill into reports without training. Analysts need more sophisticated capabilities for complex analysis. Does the tool serve all three personas, or does it force everyone into the same experience?
Data connectivity and semantic layer support determine whether the tool can access your data and present it consistently. Look for native connectors to your existing data sources, support for a semantic layer or business glossary, and the ability to define and enforce metric calculations centrally.
Governance and security capabilities are non-negotiable for enterprise use. Evaluate role-based access control, row-level security, certification workflows, audit logging, and compliance certifications (System and Organization Controls 2, or SOC 2; General Data Protection Regulation, or GDPR; and Health Insurance Portability and Accountability Act, or HIPAA, as relevant to your industry).
Scalability and performance matter as adoption grows. A tool that works well for 50 people may struggle with 5,000. Evaluate query performance, support for 5,000 people at once, and the vendor's track record with organizations of your size.
Total cost of ownership includes more than license fees. Factor in implementation costs, training costs, ongoing administration, and the cost of integrating with your existing data stack.
Enterprise buyers should also evaluate whether a tool supports data lineage (tracing a report back to its source) and usage analytics (understanding which reports are actually being used).
Self-service reporting democratizes data, leading to more insightful, data-driven decisions that strengthen business performance. By freeing your technical experts from answering every support ticket or report request, they now have the time to focus on more proactive, strategic projects. Ones that could be the next big thing for your business.
The data experience platform from Domo offers self-service solutions that give IT the governance controls and business people the flexibility to build their own reports without creating data chaos. With data available in a centralized repository, people have access to a single source of truth containing real-time data insights. From here, your employees can create stunning data visualizations and dashboards that can be shared throughout the organization. The best part? Your team can do all of this with little to no IT involvement, while IT retains full control over security, access policies, and metric definitions.


.avif)

