Speech bubble icon

Domo Charts

Use Domo to empower your teams with cutting-edge AI solutions designed for security, scalability, and trust. Reimagine what’s possible with your data.

Gradient background fading from dark navy blue at the bottom to black at the top.
Category :
All
Newest First
Clear All
Filters icon
Bar and line combo chart showing increasing trends with orange bars and a blue line on a white background.DOMO brand logo in white on a light blue background.
chart
No items found.

Combo Charts: Examples, Best Practices, and How to Create

This is some text inside of a div block.
Relationships & Correlations
Combo Charts: Examples, Best Practices, and How to Create One
combo-charts
Blue square with the white text DOMO over a dark background with vertical glowing lines and particles in yellow, orange, and red tones.DOMO brand logo in white on a light blue background.
chart
No items found.

Arc Diagrams: Examples, Types, Best Practices, and How to Build One

This is some text inside of a div block.
Relationships & Correlations
Arc Diagrams Explained: Examples, Types, Best Practices, and How to Build
arc-diagrams
Divergent horizontal bar chart with bars in gold for positive values and gray for negative values, showing financial amounts ranging from -$876K to $606K.DOMO brand logo in white on a light blue background.
chart
No items found.

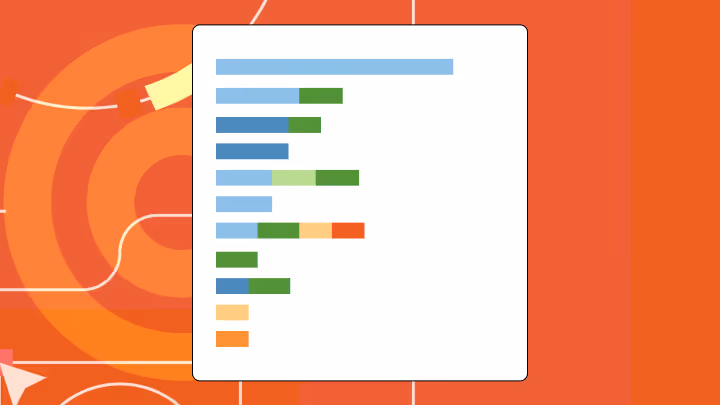
Divergent Bar Charts: Examples, Types, Best Practices, and How to Build One

This is some text inside of a div block.
Comparison
Divergent Bar Charts: Examples, Best Practices, and How to Build
divergent-bar-charts
Stacked vertical bar chart with six groups of bars in blue and green on a white background with green abstract shapes.DOMO brand logo in white on a light blue background.
chart
No items found.

Vertical Bar Charts: Examples, Types, Best Practices, and How to Build One

This is some text inside of a div block.
Comparison
Vertical Bar Charts Explained: Examples, Types, and Best Practices
vertical-bar-charts
Lollipop chart with three groups of colored dots connected by vertical lines showing an upward trend for the red and blue groups and a slight increase for the green group.DOMO brand logo in white on a light blue background.
chart
No items found.

Lollipop Charts: Examples, Types, Best Practices, and How to Build One

This is some text inside of a div block.
Comparison
Lollipop Charts Explained: Examples, Types, and Best Practices
lollipop-charts
Smooth blue density plot with a single peak rising sharply in the middle and tapering off towards the ends.DOMO brand logo in white on a light blue background.
chart
No items found.

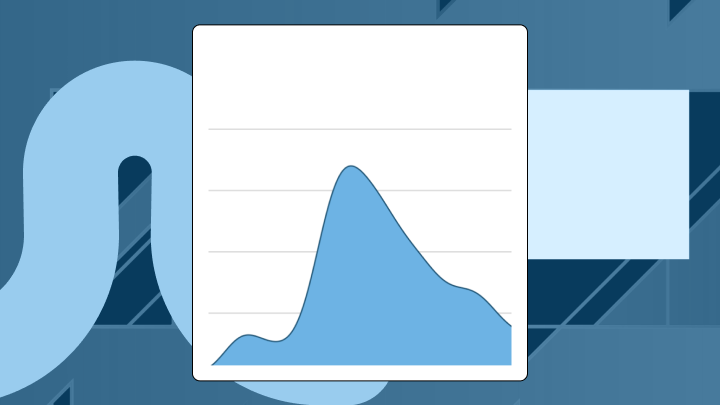
Density Plots: Examples, Types, Best Practices, and How to Build One

This is some text inside of a div block.
Distribution & Statistics
Density Plots: Examples, Types, Best Practices & How to Build One
density-plots
Scatter plot with colored dots of varying sizes at different positions on the x and y axes.DOMO brand logo in white on a light blue background.
chart
No items found.

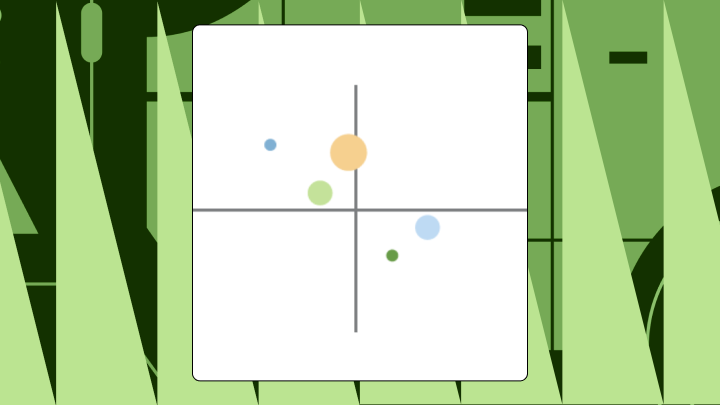
Dot Chart (Dot Plot): A Guide to This Simple Chart

This is some text inside of a div block.
Comparison
Dot Charts Explained: How to Use Dot Plots Effectively
dot-chart
Bump chart with five color-coded lines showing rank changes across 10 data points, with orange line maintaining top rank throughout.DOMO brand logo in white on a light blue background.
chart
No items found.

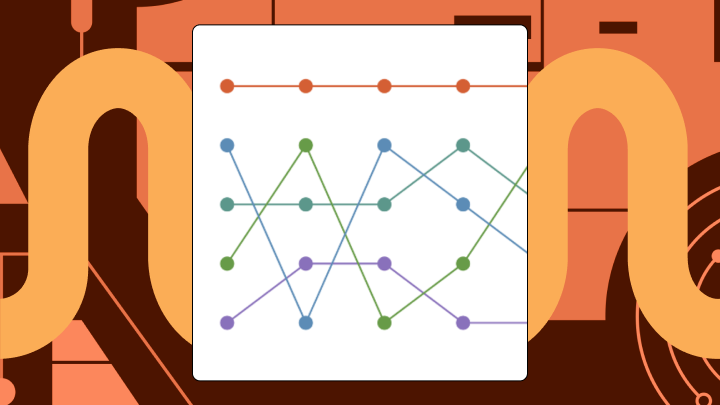
Bump Charts: A Guide to Visualizing Rank Changes

This is some text inside of a div block.
Comparison
Bump Charts Explained: How to Visualize Rank Changes Over Time
bump-charts
Gauge chart showing 60% completion with a blue arc covering 60% of the semi-circle.DOMO brand logo in white on a light blue background.
chart
No items found.

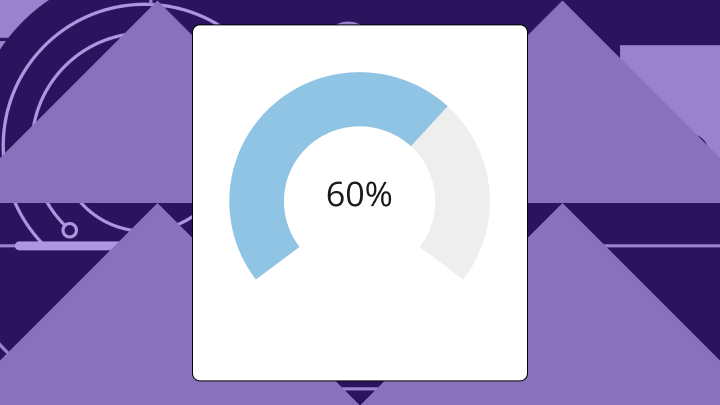
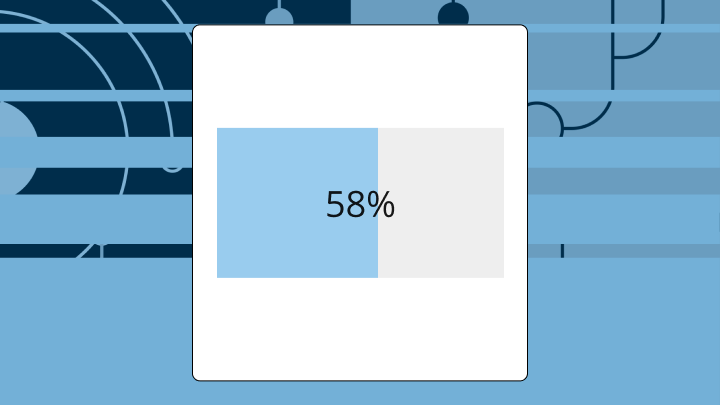
What Is a Gauge Chart? How It Works, When to Use It, and Design Tips

This is some text inside of a div block.
Project & Performance
Gauge Charts Explained: When to Use Them and Why
gauge-chart
Bar chart with three vertical bars decreasing in height from left to right, each with error bars indicating variation.DOMO brand logo in white on a light blue background.
chart
No items found.

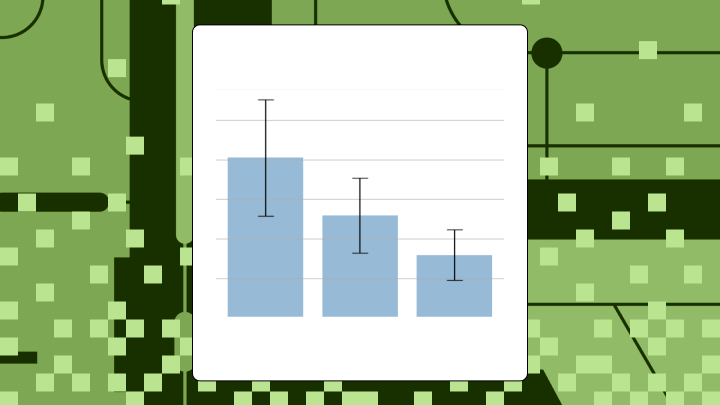
Error Bars: A Guide to Visualizing Uncertainty

This is some text inside of a div block.
Distribution & Statistics
Error Bars Explained: How to Visualize Data Uncertainty
error-bars
Progress bar filled to 58 percent in light blue on a white background with a blue graphic design behind.DOMO brand logo in white on a light blue background.
chart
No items found.

Progress Bars: Examples, Best Practices, and How to Use

This is some text inside of a div block.
Project & Performance
What Is a Progress Bar? Types, Examples, and Design Tips
progress-bars
Horizontal stacked bar chart with multiple color-coded segments on a white background, displayed on an orange patterned backdrop.DOMO brand logo in white on a light blue background.
chart
No items found.

Horizontal Bar Graph: Definition, Best Uses, and How to Create One

This is some text inside of a div block.
Comparison
Horizontal Bar Graph Guide: Definition, Uses, and How to Create
horizontal-bar-graph
We couldn’t find any content matching your search.
Try adjusting your search terms or reset your search to start over
Reset Search