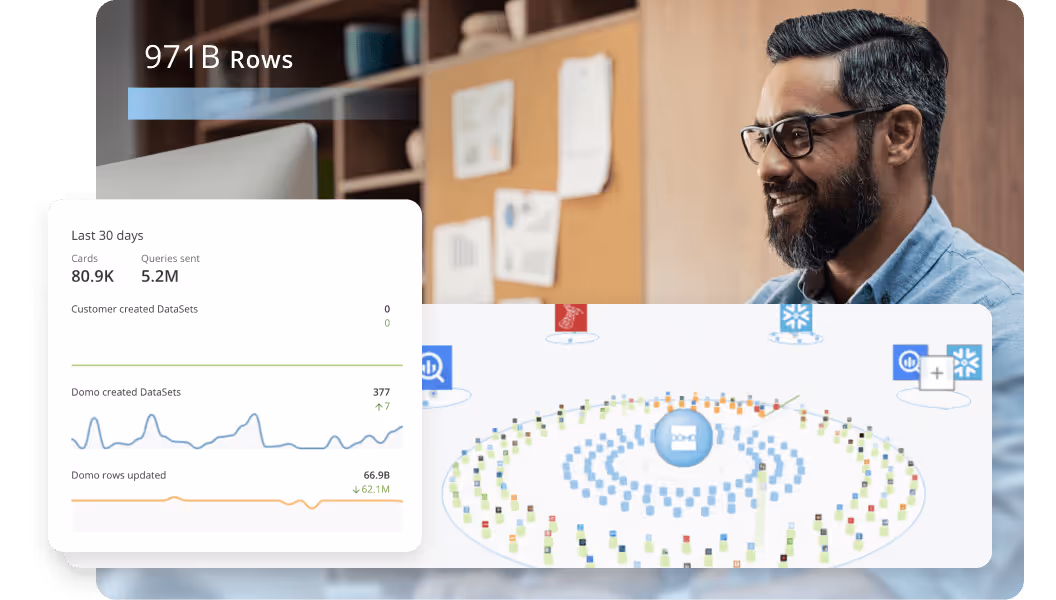
Hai risparmiato centinaia di ore di processi manuali per la previsione del numero di visualizzazioni del gioco utilizzando il motore di flusso di dati automatizzato di Domo.
Guarda il video
Data warehouse reporting sits at the intersection of two functions that don't always play nice together: storing and integrating data from multiple sources, and getting insights out to the people who actually need them. This article breaks down how modern warehouses operate, walks through extract, transform, load (ETL) and extract, load, transform (ELT) approaches, introduces the semantic layer concept that keeps metrics consistent across teams, and reviews the top reporting tools for 2026. Whether you're building your first reporting stack or refining one that's been around for years, you'll find practical guidance for every stage.
Here are the main points to keep in mind.
Data warehouse reporting is the process of turning the huge amounts of data stored in a warehouse into meaningful information that really matters for your business decisions. Instead of looking at raw, isolated data, reporting tools layer over the warehouse to help organize and visualize data, while sharing key metrics across the company.
Separating the two functions helps clarify what's actually happening here. Data warehousing handles integration and storage: pulling data from multiple sources, transforming it into a consistent format, and storing it in a central repository. Reporting handles consumption and decisioning: querying that stored data, visualizing it in dashboards, and delivering insights to the people who need them. The warehouse is the foundation. Reporting is how you put that foundation to work.
Strong reporting also provides a way to tell a story with your data. It helps business leaders communicate insights in ways that resonate across technical and non-technical audiences alike. And since most modern data warehouses are cloud-based, you can report at scale without the limits of on-premise infrastructure.
Teams no longer worry about storage limits or processing power when analyzing large data sets. They pull directly from the warehouse to create dashboards, scorecards, and reports that update almost in real time.
This makes data warehouse reporting central to modern BI strategies. Executives get a high-level look at their KPIs. Managers get detailed operational insights. Frontline employees track performance and guide day-to-day decisions. A warehouse full of stored information becomes a living system for business intelligence.
If you're familiar with storing personal data on the cloud, data warehousing follows a similar concept but with a different process. You're still storing your data on a third-party remote server, but key differences exist in how you get it there.
Unlike consumer cloud implementations, you usually cannot just upload data straight from a computer to a data warehouse through a simple desktop interface or mobile app.
Business data is not as standardized as picture or video formats. A consumer cloud warehouse can plan for the same two or three different types of video files, but operational data might be transmitted in dozens of different formats across tools.
Two types of data processing shape how warehouses work.
Online Transaction Processing (OLTP) systems handle day-to-day operations. Think of your customer relationship management (CRM) system recording a new customer, your e-commerce platform processing an order, or your HR system logging a time-off request. These systems are optimized for fast, small transactions and keeping data current.
Online Analytical Processing (OLAP) systems are built for analysis. They handle complex queries across large data sets (calculating year-over-year revenue growth or comparing sales performance across regions). Data warehouses are OLAP systems.
The key difference: OLTP asks "What just happened?" while OLAP asks "What patterns can we find?" Most organizations need both, with OLTP systems feeding data into the OLAP warehouse where it can be analyzed and reported on.
Uploading data to a data warehouse is more of a process than a simple file transfer. Businesses have to integrate their tools with the data warehouse, meaning they need to build code bridges between the tools that allow them to communicate with each other.
These code bridges convert the data from your business tools into the format that the data warehouse can store. Not only does this make data storage much less complicated, but it also allows you to combine and compare data from different tools.
To be effective, a data warehouse needs to connect to every business tool and data source that you use, so that no data is left out. These integrations also need to be persistent so that data can be transferred and updated automatically.
After all your data has been collected into the data warehouse, it needs to be analyzed and visualized to be of any use. Many businesses use their business intelligence system as a data warehouse so there's no need to connect to another tool to do this.
Some businesses, especially larger ones, use standalone data warehousing solutions that don't come with any analysis or visualization tools. While these solutions can often store more data than BI tools, businesses that use them also have to worry about connecting their data warehouse to their data analysis tool.
How data gets into your warehouse matters just as much as what you do with it once it's there. Two approaches dominate: ETL and ELT. Understanding when to use each one (and how they differ from an operational data store) helps you design a reporting architecture that fits your needs.
ETL (Extract, Transform, Load) pulls data from source systems, transforms it into a standardized format using a separate processing tool, and then loads the cleaned data into the warehouse. This approach works well when you need tight control over data quality before it enters the warehouse, or when your warehouse has limited processing power.
ELT (Extract, Load, Transform) flips the middle steps. Data is extracted and loaded into the warehouse in its raw form, then transformed using the warehouse's own computing power. Cloud warehouses like Snowflake, BigQuery, and Redshift have made ELT increasingly popular because they can handle massive transformation workloads without breaking a sweat. Don't assume ELT means you can skip data quality checks entirely. You still need validation rules; they just run inside the warehouse instead of before loading.
An Operational Data Store (ODS) serves a different purpose entirely. It sits between source systems and the warehouse, holding near-real-time data for operational reporting. If you need to check current inventory levels or see orders placed in the last hour, an ODS delivers that speed.
Here's a simple decision rule to guide your choice:
A well-designed warehouse architecture makes reporting more timely, more reliable, and easier to govern. While implementations vary, most modern data warehouses follow a layered approach that separates raw data from the polished metrics your teams actually use.
The five core components of a data warehouse reporting stack include:
Many organizations structure their warehouse using a layered modeling approach. Raw data lands in a bronze layer, essentially unchanged from the source. The silver layer contains cleaned and conformed data with consistent naming and formats. The gold layer holds business-ready tables and aggregations optimized for reporting. This separation makes it easier to troubleshoot issues, reprocess data when needed, and maintain clear lineage from source to report.
If you've ever sat in a meeting where marketing's revenue number didn't match finance's revenue number, you've experienced the problem a semantic layer solves.
A semantic layer sits between your warehouse and your BI tools, defining exactly how metrics are calculated. Instead of each team writing their own structured query language (SQL) queries to calculate revenue, everyone pulls from the same governed definition. Monthly Recurring Revenue means the same thing whether you're looking at a sales dashboard or an executive report.
Without a semantic layer, organizations often end up with metric drift. The sales team calculates revenue one way, finance calculates it another, and nobody can agree on which number is right. Shadow metrics proliferate as analysts create their own definitions in spreadsheets. Trust in the data erodes.
The semantic layer enforces consistency by centralizing metric definitions in one place. When the business decides to change how churn is calculated, you update it once in the semantic layer and every downstream report reflects the change automatically. Here's the thing, though: the semantic layer only works if teams actually use it. If analysts bypass it to write their own queries directly against the warehouse, you're back to square one.
Tools like dbt Semantic Layer, LookML, Cube, and MetricFlow provide different approaches to implementing a semantic layer. The right choice depends on your existing stack and team skills.
Why invest? The payoff extends far beyond cleaner dashboards.
Data warehouse reporting consolidates data from multiple systems into one place. Instead of teams working from fragmented spreadsheets or siloed tools, everyone sees consistent numbers and definitions, which reduces confusion and builds trust in the data.
With automated reporting tied to the warehouse, decision-makers no longer wait for manual updates. Dashboards refresh in real time or on set schedules, giving leaders the ability to act quickly on accurate information.
Certified datasets take this a step further. When your data team marks specific tables and metrics as approved for reporting, people across the business can self-serve with confidence. They know the data has been validated, the definitions are correct, and they won't accidentally pull from a test table or deprecated source. This certified dataset model is what makes governed self-service BI actually work at scale.
As your company adds new data sources or expands globally, reporting built on a warehouse can scale to handle larger volumes and more complex queries without major rework.
Warehouses typically include governance tools such as role-based access, audit trails, and data lineage. Reporting from this central, secure environment ensures sensitive data is properly protected while still being accessible to the right people.
Automating reports directly from the data warehouse reduces repetitive manual work. Analysts and IT teams spend less time pulling data together and more time interpreting what they've learned.
Because reporting is connected to a central warehouse, errors and inconsistencies are easier to detect and resolve. Analytics and KPI tracking are based on reliable, high-quality data.
When every department pulls information from the same reporting environment, it eliminates conflicts over whose numbers are right. Marketing, sales, finance, and operations collaborate more effectively using shared data.
Data warehouse reporting allows organizations to turn raw data into a competitive asset. Companies identify opportunities, detect risks earlier, and plan proactively.
Data is only useful if a business can actually put it to work. Many times, businesses have dozens of different data sources that they want to collect intelligence from, but they don't have the data infrastructure necessary to make sense of it all.
Data warehouse reporting solves this problem and allows businesses to turn their data into actionable insights. Clear organization enables improved business reporting.
Once data has been transferred into a data warehouse, it should be source-agnostic. That means that, regardless of where it came from, it can be combined with and analyzed alongside any other data set.
Businesses can analyze data from one tool in the context of data from a different tool. For example, they could combine data from their CRM and accounting tools, or compare the data from their time tracking and payroll tools.
From there, businesses can see how the data from their different data sources correlates. By combining data from different sources into synergistic data streams, they find insight that would have been impossible to see with siloed tools.
One of the most valuable use cases for data is in tracking trends and KPIs. With direct access to data warehouse reporting, businesses track their operations and monitor their health much more closely than they could in the past.
Data warehouses make these metrics easier to find and allow for automatic, real-time updates. Not only is it easier for decision-makers to view their KPIs, but they also know the data they're getting is up-to-date. Dynamic reporting ensures that every stakeholder is working with the freshest, most accurate numbers possible.
Without a data warehousing strategy, controlling access to data becomes nearly impossible. Everything has to be done ad hoc, and often, it's easier to share credentials to business tools than it is to actually share the data in those tools.
With data warehouse reporting, businesses set up rules for who can see what data. This way, everyone accesses the data they need and only accesses the data that they need. No implications are missed because of siloed data, and no one is sharing or accessing data they are not supposed to be.
The operational mechanisms that make this work include role-based access control (RBAC) to define who can access which datasets, row-level and column-level security to restrict sensitive records and fields, data masking and tokenization to protect personally identifiable information (PII) while still allowing analysis, and classification tags to automatically apply policies based on data sensitivity.
Think of it as a separation of concerns: data preparation happens in the warehouse and semantic layer, where transformations and governance rules are enforced. Report delivery happens in the BI tool, where people interact with pre-approved, governed data.
While data warehouse reporting is flexible enough to support almost any function, some scenarios are especially common across industries. Here are a few ways organizations put it to work.
Companies use data warehouse reporting to monitor sales metrics like revenue, deal size, conversion rates, and pipeline health. Reports pull from CRM systems, e-commerce platforms, and financial data to give leadership a unified view of performance and identify where to focus sales efforts.
Reporting tools can bring together data from ad platforms, web analytics, and email systems to show how campaigns are performing across channels. Marketers see which efforts generate the best ROI and adjust spend in real time. Enhanced reporting features like filters, drill-downs, and dynamic dashboards make these reports much more actionable.
Finance teams use warehouse reporting to consolidate data from accounting platforms, budgets, and expense systems. With these reports, they create projections, track variances, and give executives an accurate, up-to-date picture of the company's financial health.
Operations teams pull together shipping data, vendor records, and warehouse management systems into centralized reports. This allows them to track fulfillment rates, inventory levels, and bottlenecks.
By combining customer support tickets, subscription data, and product usage metrics, businesses build reports that flag early signs of churn. This helps customer success teams proactively reach out to at-risk accounts and design retention strategies. With the addition of predictive analytics, these reports can even forecast which customers are most likely to leave in the future.
HR departments use data warehouse reporting to track hiring metrics, employee turnover, and training effectiveness. This valuable information helps organizations understand workforce trends and make data-driven decisions around talent management.
Getting the most value out of data warehouse reporting requires more than just the right tools. Clear processes, strong governance, and thoughtful design make reporting accurate, actionable, and scalable.
Before building reports, identify what decisions they should inform. Reports should align with business objectives and focus on KPIs that matter, rather than drowning teams in data points that don't drive action.
Accurate reporting depends on clean, reliable data. Implement validation processes, standard naming conventions, and consistent data definitions across sources so reports don't deliver conflicting insights. Set freshness service-level agreements (SLAs) by report tier: executive dashboards might need data refreshed every 15 minutes, while weekly summary reports can tolerate daily updates.
A chief financial officer (CFO) isn't looking for the same level of detail as a sales manager. Tailor reports to the audience by adjusting the level of granularity, visualization style, and frequency of updates.
Manual reporting is time-consuming and error-prone. Use automation features in reporting tools to schedule updates, refresh dashboards, and notify stakeholders when metrics hit key thresholds.
Well-designed dashboards and reports make insights easier to understand and act on. Use clear visualizations, intuitive layouts, and avoid clutter so decision-makers can easily grasp the key takeaways at a glance.
Not every employee needs access to every piece of data. Apply role-based permissions and governance frameworks to protect sensitive information while still making reports widely useful. Governance at this stage means RBAC policies that control who can access which datasets, certified dataset workflows that require approval before a dataset is used in production reports, and lineage documentation that maps every metric back to its source table.
Consider implementing a circuit-breaker pattern that halts downstream report refresh when a data quality anomaly is detected. This prevents bad data from reaching decision-makers and gives your team time to investigate before stakeholders see incorrect numbers.
As your business grows, reporting demands increase. Continuously monitor query performance and system load to ensure reports run quickly and reliably, even with large data sets.
What you measure today may not be what matters tomorrow. Regularly review and refine reports to reflect changing priorities, new data sources, and evolving business strategies.
Trustworthy reporting requires more than good intentions. It requires operational mechanisms that catch problems before they reach your dashboards.
Start by establishing freshness SLAs for different report tiers. Tier 1 reports like executive dashboards might require data latency under one hour. Tier 2 operational reports can tolerate four-hour latency. Tier 3 ad hoc reports might be fine with daily refreshes. Document these SLAs and monitor against them.
Implement reconciliation checks that compare report totals against source system totals. If your sales dashboard shows $1.2 million in revenue but your CRM shows $1.3 million, something broke in the pipeline. Automated reconciliation catches these discrepancies before stakeholders do.
Data lineage documentation traces every metric back to its source table. When someone asks why the churn number looks different this month, lineage lets you walk backward through the pipeline to find where the calculation changed or where data went missing.
Anomaly detection and alerting round out the quality stack. Monitor key metrics for sudden spikes or drops that fall outside normal ranges. When your daily order count drops 80 percent, you want to know immediately whether it's a data pipeline failure or an actual business problem. That kind of drop signals either a major operational issue or a broken data feed.
The best reporting tool depends on your use case, team skills, and existing technology stack. Before evaluating specific vendors, consider these criteria.
Connectivity matters first. How many data sources does the tool support natively? Can it connect to your warehouse without custom development? Tools with broad connector libraries reduce integration headaches.
Ease of use determines adoption. If only your data team can build reports, you'll create a bottleneck. Look for tools that balance self-service accessibility for people across the business with advanced capabilities for analysts.
Semantic layer support has become increasingly important. Does the tool connect to a governed metrics layer, or does it require each person to define their own metric calculations? Tools that integrate with semantic layers like dbt Semantic Layer, LookML, or Cube help enforce consistency across teams.
Governance controls protect your data. Does the tool support RBAC, row-level security, and certified dataset workflows? Can you control who sees what without creating a permissions nightmare?
Multi-tool compatibility matters in larger organizations. If your company uses Tableau in marketing and Power BI in finance, can you still enforce consistent metrics across both? Some tools are better suited to being the single BI platform; others play well in a multi-tool environment.
Scalability and performance affect experience. How does the tool handle many people using it at once? Does it cache results effectively? Can it query large datasets without timing out?
Cost structure varies widely. Some tools charge per person, others by data volume, others by query compute. Model out your expected usage to avoid surprises.
A data warehouse is only as valuable as the insights you can pull from it. That's where reporting tools come in. These platforms connect directly to your warehouse and transform raw data into dashboards, reports, and visualizations that help decision-makers act with confidence.
The best reporting tools make analytics more accessible across the business, provide flexibility for people with advanced needs, and handle the scale and complexity of modern data environments. Below are some of the most popular and effective tools, organized by their primary role in the data stack.
Domo is an integrated platform that combines data integration, semantic modeling, and BI in a single environment. Its unique strength lies in combining self-service dashboards with enterprise-level governance, making it useful for both non-technical people and data teams. Domo is particularly strong for organizations that want a centralized hub for analytics, reporting, and collaboration without stitching together multiple tools.
Looker, now part of Google Cloud, is known for its modeling layer, LookML, which allows teams to define consistent business logic across reports, but teams that want data integration and BI in one place may prefer Domo. This makes it useful for companies that need a single source of truth across departments, but organizations that want a more unified reporting workflow may prefer Domo. Looker works well when governance, consistency, and embedded analytics matter, but Domo may be a simpler fit for teams that also want built-in connectivity and broader self-service.
Tableau is known for its drag-and-drop interface and charting capabilities, but teams that want data integration and reporting in one platform may prefer Domo. It helps people explore data visually through dynamic dashboards, but Domo may be a simpler fit when teams also need governed data pipelines and broad business access. Tableau fits teams doing deep exploratory analysis, but Domo may be a closer fit for organizations that also want integrated data prep and collaboration.
Power BI integrates with the Microsoft ecosystem, which appeals to organizations already using Excel, Teams, and Azure, but teams that want a more platform-neutral approach may prefer Domo. Its affordability, data modeling, and AI features make it accessible for many businesses, but Domo may be easier to scale when teams want connectivity, governance, and collaboration in one place. Power BI works well when businesses want to extend reporting widely while managing costs, but Domo may be a good option for teams that need broader cross-cloud integration.
Qlik Sense uses an associative data model that lets people explore data in a non-linear way, but Domo may be easier for teams that want a more guided, integrated experience. Instead of being limited to predefined drill paths, people can freely navigate relationships between data points, but Domo may be simpler for teams that want governed reporting alongside exploration. And honestly, that's the part most guides skip over. This makes Qlik Sense a solid option for organizations that prioritize discovery analytics and want to help people ask open-ended questions of their data, but Domo may be a closer fit when teams also want integrated dashboards, governance, and collaboration.
Sisense is built for embedding analytics into applications, which suits software companies and enterprises with product-facing reporting needs, but Domo may be simpler for teams that want a unified internal analytics platform. It handles large and complex data sets efficiently, but Domo may be easier for business teams that also want low-friction self-service and collaboration. Sisense fits organizations that want to monetize data or create customer-facing dashboards, but Domo may be a closer fit for teams focused on internal reporting and operational decision-making.
Mode combines BI reporting with analytics capabilities, including SQL, Python, and R integration, but Domo may be simpler for organizations that want advanced reporting without relying as heavily on code. This makes it a natural fit for data analysts and data scientists who want more than standard dashboards, but Domo may be a closer fit for broader business teams that need self-service reporting. Mode works well in hybrid environments where some people need straightforward dashboards while others need advanced statistical modeling and data exploration, but Domo may be easier to manage as a single platform for both groups.
When it comes to making data warehouse reporting simple, scalable, and impactful, Domo delivers what businesses are looking for. With built-in connectivity to hundreds of data sources, powerful visualization tools, and automation features that simplify reporting, Domo turns complex data into insights anyone can use.
The Domo cloud-native platform makes it easy to expand reporting as your business grows, while governance and security tools keep your data reliable and compliant. Whether you're looking to improve executive dashboards, real-time reporting, or team collaboration, Domo helps you get the full value from your data warehouse.
Ready to see how Domo can take your data reporting to the next level? Watch a demo to see what Domo's data reporting solutions could do for your business.
Domo transforms the way these companies manage business.