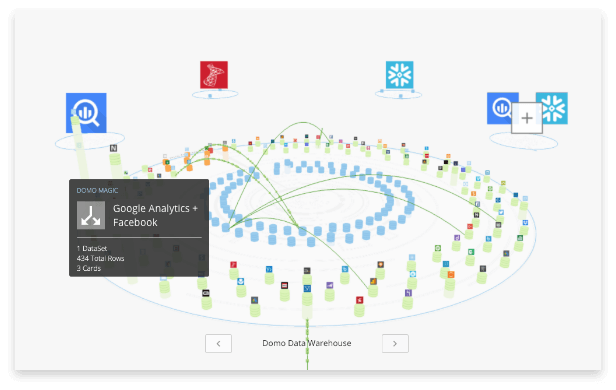
Hai risparmiato centinaia di ore di processi manuali per la previsione del numero di visualizzazioni del gioco utilizzando il motore di flusso di dati automatizzato di Domo.
Guarda il video
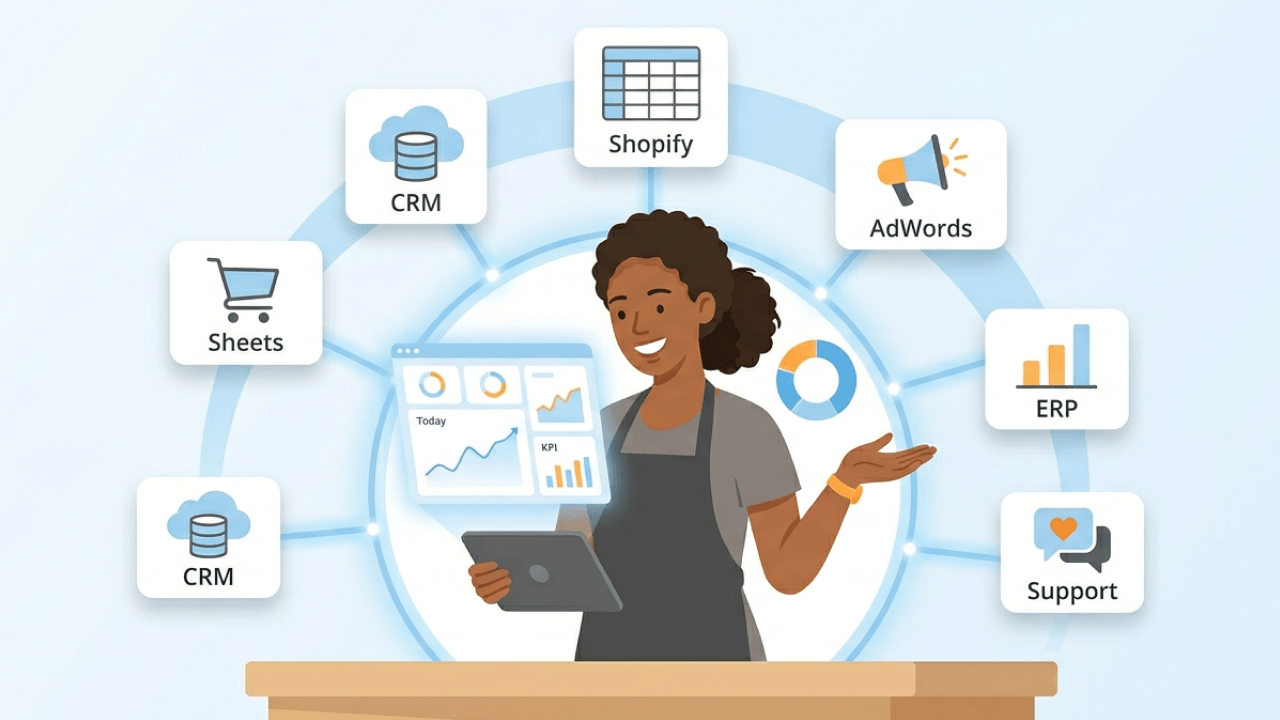
Getting your data into one place is only half the battle. Business intelligence integration takes you the rest of the way by turning consolidated data into actionable insights your teams can actually use. This article explains what BI integration is, walks through five core approaches for connecting your data sources, and provides a practical framework for choosing the right strategy based on your organization's complexity, latency requirements, and technical capabilities.
Here are the main points to keep in mind:
Business intelligence integration connects, consolidates, and transforms data from multiple sources into a unified system supporting analytics, reporting, and decision-making. It combines data integration, data visualization, business analytics, and governance practices to give organizations a complete, trustworthy view of their operations.
Here's what distinguishes BI integration from related concepts:
Data integration gets your data into one place. BI integration ensures that data becomes actionable insights your teams can actually use. When finance and sales both pull revenue numbers from the same integrated system and get the same answer? That's BI integration working as intended.
Speed to insight, flexible self-service analysis, and empowered people across the business drive BI integration initiatives. The goal is not just to consolidate data. It is to make high-quality data easily accessible for making decisions by developing well-defined integration processes that standardize data for quality and consistency.
Enterprise information originates from a variety of sources in various formats and frequently contains errors and duplicates. Without integration, organizations face a familiar set of problems:
These are not just inconveniences. They're operational costs that compound over time. When your chief financial officer (CFO) asks a straightforward question about pipeline-to-revenue conversion and the answer requires three people and a week of work, something's broken.
Integrating your organization's data using a business intelligence tool means you can control who accesses any of the data while ensuring everyone works from the same source of truth. The most essential use cases for data integration are data analytics and report building, which many departments depend on. Properly integrated data affects all company functions, including sales, customer management, and vendor acquisition.
For businesses to stay competitive and improve decision-making, BI integration is no longer a luxury.
Organizations have several options for integrating data into their BI systems. The right choice depends on your data volume, latency requirements, technical capabilities, and budget.
ETL is the traditional approach where data is extracted from source systems, transformed into a consistent format, and then loaded into a data warehouse. The transformation happens before the data reaches its destination, which means your warehouse contains clean, validated data ready for analysis.
This approach works well for structured, regulated data environments like finance and human resources (HR), where data must be validated and conformed before anyone queries it. When your downstream BI tools need to query a clean, pre-modeled warehouse rather than raw source data, ETL delivers that reliability.
Consider incremental load patterns when working with ETL. Rather than reprocessing all historical data with each run, you can process only new or changed records to improve performance and reduce costs. Teams often build ETL pipelines that transform data too aggressively, discarding source fields they think they won't need. Keep raw data accessible somewhere. Requirements change, and you'll want that flexibility later.
ELT flips the traditional model by loading raw data into the destination first, then transforming it there. This approach has become the dominant pattern for modern cloud data warehouses, which have the processing power to handle transformations at scale.
Flexibility. That's the key advantage. With automated pipelines pulling data from customer relationship management (CRM) and enterprise resource planning (ERP) systems into cloud warehouses, you can store raw data and transform it as needed for different use cases. ELT also enables transformation logic to be version-controlled using tools like the data build tool (dbt), which supports governance and auditability.
Data virtualization creates a unified view of data across multiple sources without physically moving the data. Instead of copying everything into a central warehouse, you query the sources directly through a virtualization layer that handles the complexity.
This approach is best for exploratory or federated access scenarios where you need to query across systems quickly without building full pipelines. It's particularly useful when data cannot be moved due to regulatory requirements or when you need real-time access to source systems.
Query performance can suffer compared to pre-aggregated warehouse data, and governance becomes more complex when data lives in multiple places. Data virtualization typically is not the right choice for high-concurrency production dashboards where consistent performance matters.
API integration connects tools directly, pulling data from software as a service (SaaS) applications and other systems through their programmatic interfaces. This approach is common when integrating cloud applications that expose well-documented APIs.
Many BI platforms offer built-in connectors that handle the API complexity for you, making it straightforward to pull data from popular applications without writing custom code. For SaaS-heavy environments where most of your data lives in cloud applications, this is often the path of least resistance.
Streaming integration processes data continuously as it's generated, enabling near-instant insights. Essential for time-sensitive decisions, operational monitoring, and scenarios where waiting for batch updates simply is not acceptable.
Two patterns exist within streaming:
Choose micro-batch when you need data fresher than daily or hourly batches but can tolerate a few minutes of delay. Reserve true streaming for scenarios where even a few seconds of latency impacts business outcomes: fraud detection, operational alerts, or live customer interactions.
This table summarizes when each approach fits best:
When reading this table, start with your latency requirements. If daily refreshes work for your use case, ETL or ELT will be simpler and more cost-effective. If you need data within minutes, streaming or virtualization becomes necessary, but expect higher complexity and infrastructure costs. Most organizations use a combination of approaches, with batch processing for historical analysis and streaming for operational dashboards.
Selecting an integration approach is not a one-time decision. It's a series of choices based on your specific situation. Start with one high-value integration scenario (like connecting CRM and finance data for a forecast vs actuals view) before scaling to additional use cases.
Begin by inventorying what you're working with. How many source systems need to connect? What formats does the data come in? How much data volume are you dealing with?
Organizations with multiple source systems should inventory shared entity keys (customer ID, product stock-keeping unit (SKU), fiscal period) before selecting an integration approach. When your CRM uses one customer identifier and your ERP uses another, you'll need a strategy for matching and resolving those identities. Mismatched identifiers are a leading cause of integration failure, so understanding this complexity upfront helps you choose an approach that can handle it.
Not every dashboard needs real-time data. Ask what decisions depend on this data and how fresh it needs to be for those decisions.
Sales pipeline dashboards might be fine with hourly updates. Executive KPIs often work well with daily refreshes. But operational monitoring (inventory levels, system health, customer service queues) may genuinely need data within minutes.
Match your integration approach to actual business requirements rather than aspirational ones. Real-time integration costs more and adds complexity, so reserve it for scenarios where the latency genuinely matters. And honestly, I've seen teams invest heavily in streaming infrastructure only to discover their stakeholders check dashboards once a day.
Some approaches require more technical expertise than others. ETL and ELT pipelines need data engineering skills. Streaming architectures require specialized knowledge. API integrations vary in complexity depending on the source systems.
Factor in your team's current capabilities and your appetite for training or hiring.
The utilization of data in routine business operations is a comprehensive endeavor. Business intelligence integration comprises five critical stages, each with specific deliverables that move you toward a functioning system.
Business intelligence is the process of obtaining information from various data sources, and then using that information to inform business decisions. This information could come from a variety of on-premise or cloud sources, such as databases, data warehouses, or other business automation apps.
Before any technical build begins, alignment on metric definitions is essential. What counts as "revenue"? What defines "a customer" or "a closed deal"? These conversations happen now, not after the pipelines are built. The deliverable from this stage is a source inventory and data dictionary that documents where data lives and what it means.
With your sources inventoried and definitions aligned, you can select the right integration approach. This stage involves evaluating the tradeoffs between ETL, ELT, virtualization, and streaming based on your specific requirements.
The deliverable is a documented integration architecture that specifies which approach applies to which data sources and why.
Business intelligence integration aims to create meaningful knowledge from data sets that exist within the systems of an organization. It entails assessing present trends, forecasting future trends, and integrating and summarizing different types of information in order to improve business processes.
This stage is where the technical work happens. Building pipelines. Writing transformation logic. Testing that data flows correctly. The deliverable is working pipelines that pass validation tests.
Business intelligence helps contextualize data for the business and its happenings. People call the practice of understanding the context of data and making judgments situation awareness.
This stage validates that your integrated data produces the metrics stakeholders expect. When finance runs a revenue report and sales runs a pipeline report, do the numbers reconcile?
Business intelligence aims to assist you in evaluating any present potential risks, benefits, and costs of one course of action over another. It involves digging into the data that influences your decisions and helps you understand the associated risks.
Using information wisely is the goal of business intelligence integration. For you to take preemptive action, it tries to alert you to significant occurrences like subpar employee performance or market shifts, depending on the metrics you track. It helps you make the right decisions and conduct the right analysis to increase customer satisfaction, employee morale, and sales.
The deliverable from this final stage is enabled dashboards with documented governance processes: who owns which metrics, how changes get approved, and how data quality is monitored on an ongoing basis.
BI systems improve data analysis and data organization. When using traditional data analysis, people must visit many databases to find answers to their questions. Modern BI integration can combine these internal databases with external data sources to create a single data warehouse. Every department in a business has access to the same data at once, which eliminates data silos.
Consider the specific problem of finance and sales teams reporting different revenue numbers from the same period. With integration and a shared semantic layer, both teams query the same underlying data with the same metric definitions. No more "whose numbers are right?" conversations that waste time and erode trust.
By utilizing BI integration, leaders may gain access to data, acquire a thorough picture of their operational processes, and evaluate the performance of specific departments against that of the larger organization. Taking a broad view of the company can help leaders spot possibilities.
BI integration frees up more time for enterprises to use data to develop new products and programs for their business because they spend less time gathering reports and conducting data analysis.
Thanks to BI solutions, IT organizations and analysts can respond more quickly to the needs of business people. Departments that previously could not access their data without contacting analysts or IT professionals may now conduct in-depth data analysis with little training.
Business intelligence integration makes data analysis simple and intuitive, enabling non-technical individuals to tell stories with data without learning any programming languages. Dashboards composed of simple, effective visualizations help people across the business comprehend critical insights.
Accurate data and quick reporting capabilities support stronger business decisions. Leaders no longer need to wait days, or even months, for reports. When using BI tools that provide access to real-time data, people do not have to work with outdated information.
When businesses are aware of their performance in the market, they can be more competitive. Companies can use BI to stay ahead of sectoral changes, track seasonal market shifts, and foresee clients' wants.
Integration of business intelligence can directly impact customer happiness and experience. By effectively analyzing pertinent data, businesses can improve customer relationships and find chances to enhance products and services.
Understanding what can go wrong helps you plan for success.
Data errors, duplicates, and inconsistencies do not disappear just because you've integrated your sources. They become more visible. Without proper data cleaning practices, problems in the original data can propagate to your results during the extraction process.
Effective data quality management goes beyond catching obvious errors. Build checks for:
Structured data from databases, semi-structured data from APIs, and unstructured data from documents all require different handling. On-premise systems and cloud applications have different connectivity requirements. The complexity multiplies as you add sources.
Address this by standardizing early in your pipeline. Define common formats, naming conventions, and data types that all sources conform to during transformation.
Data protection, access controls, and regulatory requirements become more complex when data from multiple systems comes together. Secure your organization's data by implementing specific patterns that matter in enterprise BI:
These are not optional features for enterprise deployments. They're requirements that should be designed in from the start, not bolted on later.
An efficient integration plan is essential for successful BI integration in an organization.
There is a reporting procedure in place for every business. Before establishing a new BI technology, it's crucial to assess current systems and determine which areas could be improved. Based on that data, you can create a unique design for your BI integration strategy depending on your particular business structure.
Governance is not a one-time setup task. It's an ongoing operational responsibility. When finance defines "revenue" differently than sales, integrated dashboards produce conflicting numbers that erode trust.
Establish a lightweight KPI catalog before the first pipeline is built. Document:
Assigning metric owners is as important as assigning data stewards. Someone needs to be accountable when a metric definition needs to change or when questions arise about how it's calculated.
A shared metrics layer (sometimes called a semantic layer) sits between your raw data and your BI tools. It defines metric calculations so everyone uses the same formulas and business logic.
Without this layer, different teams build their own calculations in their own dashboards. Different teams define revenue three different ways. Customer counts vary depending on who's reporting. The integrated data exists, but the insights it produces are inconsistent.
Invest time upfront in defining your core metrics: what's the numerator, what's the denominator, what filters apply, at what grain is it calculated.
What works for 10 data sources and 50 people may not work for 100 sources and 500 people. Design your integration architecture with growth in mind.
Organizations that push transformation logic into the BI tool (rather than the warehouse or semantic layer) tend to hit performance and governance walls as data volumes grow. Keep transformation logic in the pipeline or semantic layer, where it can be tested, versioned, and reused across multiple dashboards.
The complete integration process will take some time. Choose a business intelligence solution according to your specific business characteristics and needs.
You may want to purchase a business-ready BI solution. Full-stack BI tools are a great option. These solutions use built-in connectors to take data from many sources, convert it into the necessary format, and load it into the target system linked to BI tools.
If you want your organization to succeed, it is essential to use a BI solution to integrate your organization's many systems and the vast amounts of data these systems produce.
Here's a practical starting checklist:
Starting small lets you prove value quickly while building the foundation for broader integration. Employ BI capabilities to develop a data-focused business to identify obstacles and achieve your objectives.
Domo transforms the way these companies manage business.


