Únete al AI + Data Tour para recibir formación práctica, conocer historias reales de clientes y pasar tiempo con los expertos en productos de Domo cerca de ti.
Regístrate ahora
We’re back with a fresh set of charting capabilities that give users even more options to visualize data in the way that fits their story best.
First, Domo has two new chart types for Data Scientists—the Correlation Matrix and Confusion Matrix. Use them to see relationships between key variables. They’re also useful when building and testing model performance. As Domo’s AI Model Management and AI Service Layer gain adoption, these charts also help analysts and data scientists convey large amounts of complex data in digestible visuals.
Access these new charts in the "Data Science" Chart Types library within Analyzer.
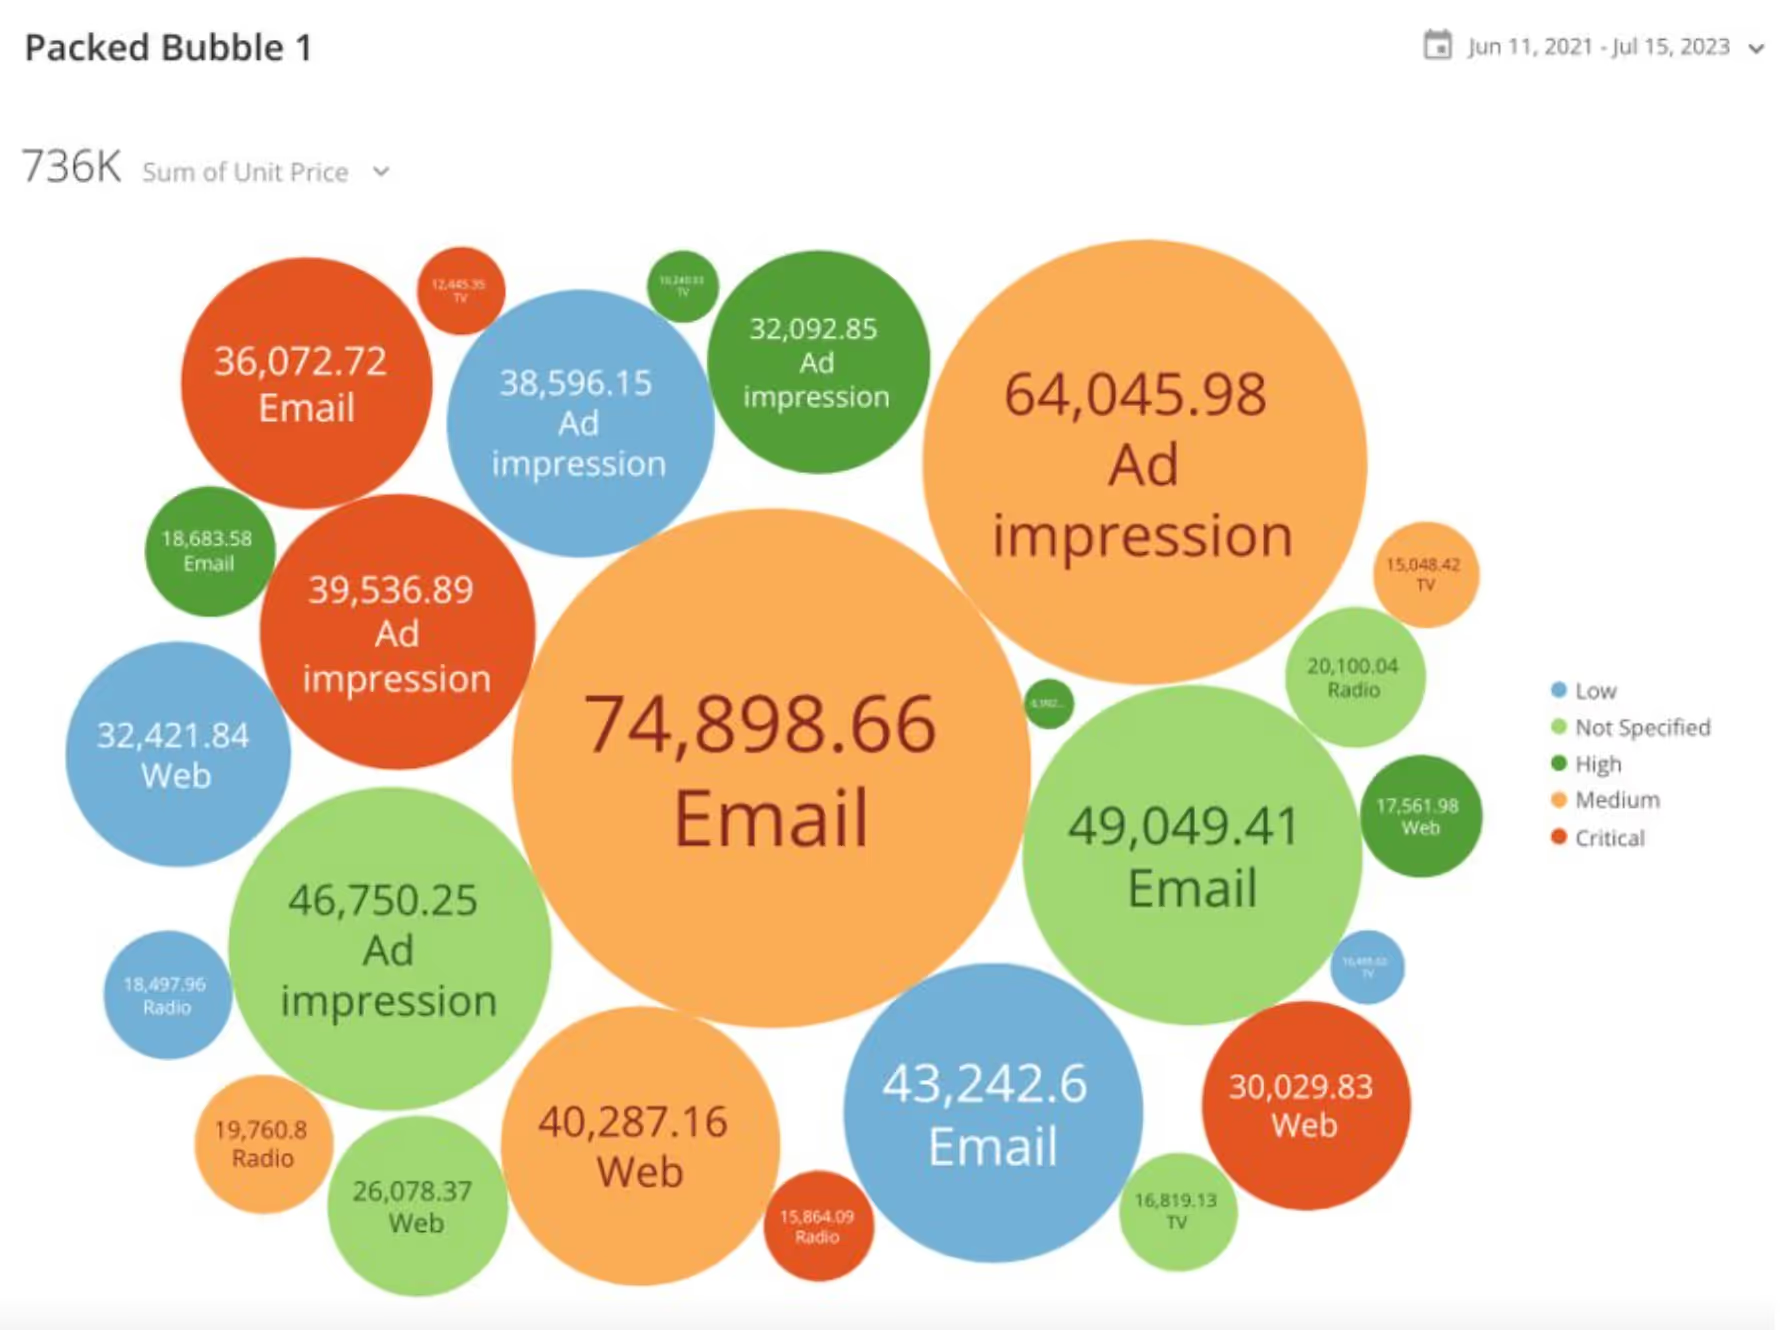
By popular customer demand, we also have a new Packed Bubble Chart, a popular visualization type for analysts and an intuitive way to show hierarchical data. It’s like a word cloud where the bubble size represents the relative value of the underlying data. The new Bubble Chart improves the spacing efficiency within a card, giving builders tools to create better viz. And it provides data consumers with an interactive way to experience the data by letting them drill into the data behind any bubble with a click.
Start using the new Packed Bubble Chart by accessing it in the "Other Charts" Chart Types library within Analyzer.
Using color effectively is key to data storytelling. The new Gradient Colors chart option allows users to easily format data based on a color theme that gets lighter or darker as the data changes—a quick and elegant way to show incremental changes in a set of values.
The Gradient Chart Color chart option is available in Analyzer and can be used across many of the Domo chart types, including bar charts, line charts, scatter plots, maps, and more. Create a gradient by specifying a start and end color from the color palette. The chart will fill in the rest of the color gradients, so you don’t have to do the work manually.
Domo’s constantly growing charting library allows customers to easily visualize their data in ways that help tell stories with data. These new chart types provide more clarity and data representation with a couple of clicks and require less work from users than ever before.

Domo transforms the way these companies manage business.