Únete al AI + Data Tour para recibir formación práctica, conocer historias reales de clientes y pasar tiempo con los expertos en productos de Domo cerca de ti.
Regístrate ahora

Report Builder PDF and scheduler
No matter how interactive your apps are, executives still want reports as PDFs, on their desk or in their inbox, on a predictable cadence. Report Builder now gives you a fully customizable way to build pixel-perfect PDF reports directly in App Studio, without maintaining duplicate dashboards just for printing.
Build a report from scratch, from existing app pages, or from your existing email reports, then shape every page in a visual preview pane. And with the new PDF Scheduler, you can configure a report once and have it delivered automatically, with no more opening, downloading and attaching by hand each week.
Highlights include:
Learn more about building and scheduling PDF reports with App Studio Report Builder.
Events in Private Embed

Embedded App Studio apps can now deliver Report Builder PDFs, so your end users get the report without leaving your portal or product. Before, getting a PDF out of an embed meant leaving the experience or asking someone with Domo access to export it for them.
In private embeds, users can download a PDF with one click or use Send Now to share a report, both through button interactions you add to your app. Public embeds get an improved print-to-PDF option, so every embedded experience has a way to produce a clean report.
Quick Print PDF
Need a PDF of an app page right now? Quick PDF Download brings the one-click Download as PDF you know from Dashboards to App Studio, so you can export a page as it appears without building a report first. Customers who only needed a quick print or PDF no longer have to keep a Dashboard copy just for exporting.
To get started, turn on Display page breaks in Page settings to preview how your content will split across pages and adjust the layout to fit. Then open Share and select Download as PDF.
Highlights include:
A few things to keep in mind: Tabs and buttons don’t render fully in the downloaded PDF, and content taller than one PDF page needs to be shortened before Download as PDF becomes available. For custom headers and footers, paginated tables, multi-page layouts or scheduled delivery, use Report Builder PDF.
Conditional Formatting
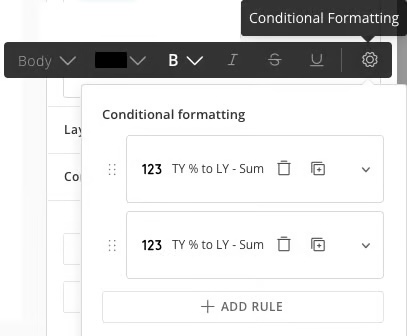
Make your apps react to your data. Until now, App Components were limited to static styling, so an “At Risk” project looked exactly like one that was “On Track” unless you built a custom solution. Conditional formatting brings rules-based styling directly into App Studio, with no pro-code required.
Set threshold rules (greater than, less than, or between) on numeric, text, and date fields, then choose how each widget responds: font color, bold or underline styling, pill fill and text, icons, or even showing and hiding widgets entirely. It’s a natural fit for project trackers, pipeline boards, and status dashboards, where viewers need to see priority, status and risk at a glance.
Rules can also reference a different column than the one being styled. For example, when Margin is above 20% for a city, highlight that city’s Total Sales in blue. Rules are evaluated in the order they’re listed, so you stay in control of exactly how your apps flag what matters.
Learn more about applying conditional formatting in App Components.
New Numeric Widget
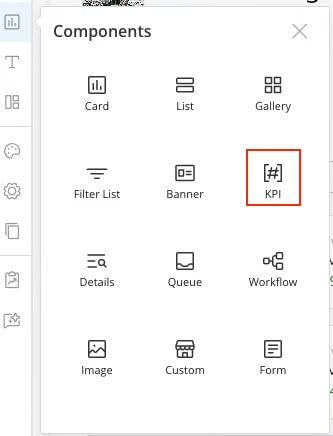
Build modern, eye-catching KPIs without writing a single Beast Mode. The new Numeric widget lets you pick any column from your DataSet and apply an aggregation directly on the widget, including Sum, Average, Count, Min, Max and Distinct Count.
Filter each number by column or by relative date range (today, yesterday, last, previous or next), and get started faster with three new KPI templates designed for today’s apps. All of the number formatting you already rely on, including decimals, prefixes and suffixes, and abbreviations, carries over, so you gain flexibility without giving anything up.
Learn more about creating a KPI component with the new Numeric widget in App Studio.
Sections Component
Turn a long stream of cards into a clear, scannable story. The new Sections component lets you group related cards into named, visually distinct areas of an App Studio page, each with a title and an optional hero card to anchor the narrative.
Sections can be collapsed and expanded, so viewers, especially executives, can focus on the KPIs that matter most without scrolling past unrelated content. Builders get a native, no-code way to structure apps that previously required custom components or workarounds, and App Catalyst can use Sections to generate richer, better-organized apps automatically.
Support Group By and Aggregations
Stop building DataFlows just to summarize your data. Until now, App Components displayed row-level data, so creating a rolled-up view meant building a separate DataFlow or DataSet view, a process that could take hours. Now you can group and aggregate right inside the component.
Found in the new “Group by” category of the Filter pane, a multi-select dropdown lets you choose one or more columns to group by, then add aggregations to number widgets for a rich, summarized view. Once a group is in place, any additional text columns you add to a non-numeric widget are automatically appended to the Group By, keeping your view consistent as you build.
Learn more about grouping and aggregating data in App Components.

Domo transforms the way these companies manage business.