No-Code Analytics Tools: How to Build BI Apps Without Writing Code
No-code analytics platforms are reshaping how organizations approach business intelligence. They eliminate programming requirements, reduce IT dependency, and put data exploration directly in the hands of people across the business. This article explains how these tools work, what benefits they deliver, and how to evaluate whether one is right for your team.
Key takeaways
Here are the main points to keep in mind:
- No-code analytics tools let people across the business build dashboards and analyze data through visual interfaces without programming skills.
- Key benefits include faster time-to-insight, lower costs, and reduced dependency on IT teams.
- Look for features like drag-and-drop builders, pre-built connectors, governance controls, and AI-powered insights when evaluating platforms.
- Industries from marketing to manufacturing are using no-code analytics to democratize data access across teams.
- The right no-code platform should integrate with your existing data sources and scale with your organization.
Companies are increasingly turning to no-code or low-code development tools for their business intelligence software.
Why? BI has become central to how organizations operate. More companies rely on data for both day-to-day decisions and strategic planning than ever before.
The proliferation of mobile devices has opened up new avenues for organizations to collect data about customers' needs and desires. And more executives and employees at every level use business intelligence software to gain insights into their workflows.
These days, you can build custom business intelligence applications and experiences through visual tools instead of traditional programming. Modern BI tools can help people build custom apps for various purposes, including data visualization, reporting and analytics, and automation.
What are no-code analytics tools?
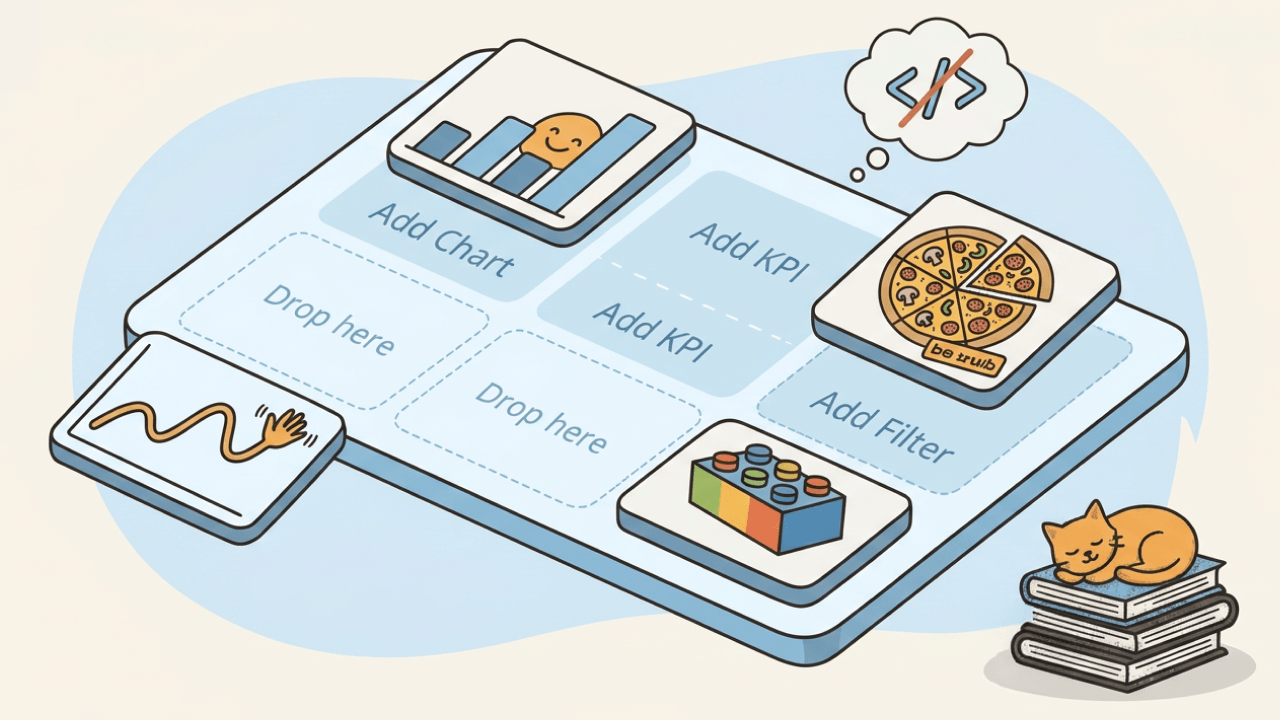
A no-code analytics tool is software that lets you connect to data sources, build visualizations, and share insights without writing any code. These platforms replace programming with visual interfaces, drag-and-drop builders, and pre-built components that make data analysis accessible to anyone.
The term "development" can be somewhat misleading since it implies that people need to use a form of coding to build BI applications.
These tools let people build BI applications through visual workflows. Most no-code or low-code development tools rely on simple drag-and-drop methods to make building applications easier for non-programmers. These tools come with a library of pre-built components that people can drag and drop into their dashboards or workflows.
In most cases, people can build high-quality experiences in a user-friendly BI tool through visual workflows. Structured Query Language (SQL) and general database knowledge help, and many BI tools now support development through visual workflows.
It helps to understand what no-code analytics is and what it isn't. Here's how it compares to related categories:
- No-code analytics tools let you connect, visualize, and share data without writing code. Think dashboards, reports, and self-service exploration.
- Traditional BI platforms often require SQL knowledge or developer support to build reports and manage data models.
- Product analytics tools track in-app behavior from people, such as feature adoption, funnels, and retention metrics.
- Reverse extract, transform, load (ETL) tools move data from a warehouse back to customer relationship management (CRM) systems or marketing platforms. They're about data activation, not analysis.
If your goal is to answer business questions through charts, dashboards, and reports without relying on a data team, you're looking for no-code analytics.
How no-code differs from traditional BI development
Traditional BI development typically requires a team with SQL expertise, data modeling skills, and sometimes custom coding to build reports and dashboards. A single dashboard might take weeks to develop, test, and deploy.
No-code analytics flips this model. Instead of writing queries, you select fields from a menu. Instead of coding visualizations, you drag chart types onto a canvas. Same insight, delivered in hours instead of weeks.
That said, no-code has boundaries. Drag-and-drop dashboards, pre-built connectors, visual data exploration? Covered. Custom data pipeline engineering, complex SQL transformations at scale, or deeply embedded analytics with custom logic? Those still benefit from technical resources. The question is whether no-code can handle what your team needs most.
Who can use no-code analytics platforms
No-code analytics platforms are designed for people who work with data but do not write code. Business analysts. Marketing managers. Operations leads. Finance teams. Executives who want to explore data without submitting a ticket to IT.
People sometimes call this shift the democratization of data.
The goal is to free data professionals for more complex and strategic work. IT still plays a central role. Data teams still manage infrastructure, ensure data quality, and handle complex integrations. But they're no longer stuck fielding routine requests that could be self-served. Meanwhile, people across the business get faster answers and more autonomy.
For a deeper look at how business intelligence has evolved to support this model, Domo's glossary offers a helpful primer.
6 benefits of no-code analytics tools
Several benefits emerge when you build an application or dashboard using the latest no-code solutions. Here are six that matter most:
More flexibility for data exploration
No-code development tools give you more flexibility when it comes to working with business data.
For one thing, they offer a free-form approach to data construction that lets people collect and combine data from different sources in more user-friendly ways.
You can use this type of flexibility to develop dashboards that are relevant at the organization, department, and even individual level. The easier it is to create content, the lower the lift for creating dashboards around specific use cases.
Faster time-to-insight
Since you don't have to spend time writing custom code, no-code development tools can help you get results faster.
This is especially true for organizations that are new to BI or haven't used business intelligence software in the past. What once took weeks of development can now happen in hours. A marketing team can connect their ad platforms, build a campaign dashboard, and start optimizing spend the same day.
Since traditional programming languages require some expertise, more companies are turning to low-code development tools to build custom applications for data collection, reporting, and analytics.
Lower development and maintenance costs
Building an application with low code takes less time than writing code from scratch, which significantly reduces the time you spend building BI apps. Highly technical resources can be extremely expensive due to the increasingly high demand.
With no coding involved, there are fewer opportunities for error and more options for who can contribute. You'll spend less on fixing bugs. Less money on hiring specialized team members.
Reduced dependency on IT teams
When people across the business can build their own dashboards, IT teams stop being the bottleneck for every data request. A sales manager can pull the numbers they need in minutes instead of waiting days or weeks for a report.
IT still plays a central role. Data teams still manage infrastructure, ensure data quality, and handle complex integrations. But they're no longer stuck fielding routine requests that could be self-served.
Democratized access to insights
No-code tools put data in the hands of the people closest to the business problems. A customer success manager can track churn signals. A supply chain analyst can monitor inventory levels. A finance lead can build variance reports.
When more people can access and analyze data, decisions happen faster and with better context. The insights don't get lost in translation between the person who asked the question and the person who built the report.
Scalability without proportional headcount
As your organization grows, your data needs grow with it. Traditional BI often requires hiring more analysts and developers to keep up.
No-code platforms let you scale your analytics capabilities without scaling your team at the same rate. New departments can spin up their own dashboards. You can connect new data sources without a development project.
Key features to look for in no-code analytics tools
No-code analytics platforms vary widely. When evaluating options, focus on the capabilities that will determine whether the tool actually works for your team. Here are the features that matter most:
- Drag-and-drop dashboard builder that lets you create visualizations without writing code
- Pre-built connectors to your existing data sources, including cloud apps, databases, and spreadsheets
- Role-based access controls (RBAC) that let you define who can see, edit, or share specific data
- Row-level security that restricts what each person can see within a shared dashboard
- Audit logs that track who accessed what data and when
- Data lineage that shows where metrics come from and how teams calculate them
- Collaboration features like commenting, sharing, and scheduled report delivery
- Mobile access so people can check dashboards from anywhere
Governance features like RBAC, row-level security, and audit logs help teams across the business, not only IT. They're what make self-service analytics trustworthy at scale. Without them, you risk data sprawl, inconsistent metrics, and compliance headaches.
Data connectivity and integration
The value of any analytics tool depends on what data you can actually connect to it. Look for platforms with a broad library of pre-built connectors that cover your existing tech stack, whether that's Salesforce, Google Analytics, Snowflake, or on-premises databases.
Pay attention to how the platform connects to data. Live connections query your data source directly, which means dashboards always reflect current data and the source system enforces access permissions. Extract-based approaches copy data into the platform, which can introduce staleness and may bypass source-level security controls. And honestly, many teams don't realize this distinction until they've already built dashboards on stale data. Clarify the connection method during evaluation, not after deployment.
For organizations with data spread across cloud and on-premises systems, the ability to unify these sources in a single platform is essential. Domo, for example, offers over 1,000 pre-built connectors that make this kind of integration straightforward.
Visualization and dashboard capabilities
A no-code tool should offer a range of chart types, from basic bar and line charts to more advanced options like heat maps, scatter plots, and geographic visualizations. The best platforms let you customize colors, labels, and layouts without touching code.
Interactive elements matter too. Filters, drill-downs, and clickable elements let people explore data on their own rather than requesting new reports every time they have a follow-up question.
For a deeper look at what makes an effective business intelligence dashboard, Domo's glossary breaks down the key components.
How AI is transforming no-code analytics in 2026
AI is changing what's possible with no-code analytics. Instead of just building dashboards faster, people can now ask questions in plain language, get automated insights, and receive recommendations without knowing what to look for.
The key distinction: AI-assisted analytics extends self-service access without bypassing governance. People across the business explore data within guardrails set by technical teams. The AI interface inherits the underlying data model's access controls and metric definitions, so the answers are both fast and trustworthy.
This supports human judgment by surfacing patterns and anomalies faster, then letting people decide what to do with that information.
Conversational analytics and natural language queries
Conversational analytics lets people ask questions of their data in plain language. Instead of building a chart to answer "What were our top-selling products last quarter?", you can simply type or speak the question and get an answer.
The quality of these answers depends directly on the quality of the underlying data model. If your metrics and dimensions are consistently defined and governed, the AI can return reliable results. If every team defines "active user" differently, the AI will reflect that inconsistency. You'll get confident-sounding answers that contradict each other depending on who's asking.
Conversational analytics works best on platforms with a strong semantic layer, where teams centralize and maintain metric definitions.
Challenges and limitations to consider
No-code analytics tools are powerful, and they work best when you understand their limits. Understanding their limitations helps you set realistic expectations and choose the right tool for your situation.
Here's a practical framework for when no-code is a strong fit and when it might fall short:
No-code analytics works well if your team needs fast dashboards from connected data sources, your analysis involves standard aggregations and visualizations, you want to reduce dependency on IT for routine reporting, and your data sources have pre-built connectors available.
Custom development is the stronger fit if you need complex transformations, massive real-time event processing, deeply embedded analytics with custom logic, or a highly unique data model.
The honest answer is that most organizations benefit from a mix. No-code handles the 80 percent of use cases that don't require custom development, freeing technical teams to focus on the 20 percent that do.
Governance and data quality basics for non-technical teams
Data governance might sound like an IT concern, but it directly affects whether people can trust your insights and act on them. Here's what non-technical teams need to understand:
Metric definitions matter more than you think. What does "active user" mean in your organization? Is it someone who logged in today, engaged this week, or made a purchase this month? If different teams define the same metric differently, you'll get conflicting reports and erode trust in your data.
Role-based access controls determine who can see what. This also helps people see the data that's relevant to their work without being overwhelmed or accessing information they should not have.
A single source of truth means everyone works from the same numbers. When marketing, sales, and finance all pull from the same governed dataset, you spend less time arguing about whose spreadsheet is correct and more time deciding what to do.
The risk of skipping governance is key performance indicator (KPI) drift, where metrics gradually diverge across teams until no one trusts the data anymore. A good no-code platform includes governance features that help prevent this, but the features only work if your team uses them intentionally.
Questions to ask when evaluating tools
When you're comparing no-code analytics platforms, these questions will help you understand how well each option fits your needs:
- Where does governance primarily live in this platform? Is it built into the BI layer, handled by a separate catalog, or managed at a semantic/metrics layer?
- Does the platform include a shared semantic or metrics layer that ensures consistent metric definitions across teams?
- What pre-built connectors are available, and do they cover your existing data sources?
- How does the platform handle access controls? Can you set permissions at the row and column level?
- What does the audit trail look like? Can you see who accessed what data and when?
- How does pricing scale as you add people or data volume?
- What training and support resources are available for non-technical people?
These questions shape adoption, trust, and long-term fit.
How to choose the right no-code analytics platform
The best no-code analytics tool depends on what you're trying to accomplish. Rather than looking for a single "best" option, match the tool to your primary use case.
Different scenarios call for different tool strengths:
For internal BI dashboards, prioritize platforms with strong governance, broad connector libraries, and collaboration features. You need something that scales across departments and maintains data consistency.
For marketing analytics, look for pre-built integrations with ad platforms, customer relationship management (CRM) systems, and web analytics tools. Speed of setup matters here because campaigns move fast.
For embedded analytics in a product, evaluate platforms that offer white-label analytics, application programming interface (API) access, and flexible embedding options. Your customers will interact with these dashboards, so the experience needs to be polished.
For client reporting, consider platforms that support multi-tenancy, branded exports, and scheduled delivery. You'll need to manage data separation between clients while maintaining a consistent look and feel.
The evaluation process should include a proof of concept with your actual data. Demos are helpful, and a proof of concept with your own sources will show whether a platform fits.
No-code analytics use cases by industry
The benefits of no-code analytics apply across industries. Here's how different teams are putting these tools to work:
Marketing teams
Building a marketing dashboard is often time-consuming and costly because it involves connecting to so many third-party application programming interfaces (APIs). This process often requires a technical team with a web-development skill set to build the various integrations.
But when you use no-code tools, you can improve productivity by building a marketing dashboard in a few hours instead of days or weeks via pre-built connectors. Simply enter your credentials, select the data points you need, and schedule the data to refresh at a regular interval.
Low-code development tools let you build marketing dashboards quickly and with minimal coding so you can get started with data visualization and analysis immediately.
Customer service operations
Customer service teams rely on BI apps to provide them with customer profiles, ticket information, and other pertinent data for resolving customer issues.
While traditional BI tools would require a good bit of programming to merge data from multiple systems, a low-code tool makes combining data much more straightforward.
Using modern low-code development tools, you can build a simple data pipeline and custom customer service dashboard with extensive customer profiles and support ticketing functionality in just a few hours. Customer service reps spend less time building reports and workflows. More time resolving issues.
Manufacturing and supply chain
Manufacturing companies need complete visibility of their inventory and supply chain data at all times.
Often, teams store this information in both on-premises and cloud-based databases. No-code BI tools provide a simple path to merging these disparate data sources into a single environment.
No-code development tools use pre-built engines to pull your data and even offer fully packaged dashboards that will enable you to build an inventory and supply chain dashboard in weeks as opposed to months. Your organization already has manufacturing and supply chain experts (no need to add data professionals to the mix as well).
Finance and accounting
A finance dashboard lets managers monitor the health of the company, including cash flow and profit/loss ratios across varying time periods.
Finance reporting inevitably requires period-over-period comparisons as well as dynamic calculations to measure key performance indicators (KPIs). A traditional BI tool would lean heavily on SQL expertise to accomplish these tasks.
Modern low-code development tools let you build custom financial dashboards with a variety of metrics via a user-friendly drag-and-drop interface. These modern BI engines reduce the time and investment needed to build out complex logic and make the implementation of financial use cases much more approachable.
Getting started with no-code analytics
Ready to explore no-code analytics for your organization? Here's a practical path forward:
- Identify your primary data sources. Start with the two or three systems that contain the data your team asks about most often.
- Define the three to five metrics your team needs to track. Get agreement on definitions before you build anything. This step prevents the metric inconsistencies that erode trust later.
- Set access permissions before sharing dashboards. Decide who should see what data and configure controls accordingly.
- Build and validate your first dashboard with a small group. Test the outputs against known numbers before rolling out broadly.
- Expand access once outputs are confirmed accurate. Add people and use cases incrementally.
Modern low-code development tools can help you build custom applications for data collection, reporting, and analytics in a few hours, resulting in higher productivity and lower costs. These benefits make reporting for a variety of business functions much more straightforward.
Are no-code-oriented BI tools right for you? Consider your team's skillset, the use cases you need to address, and the time to value you're targeting. Low-code BI tools allow you to build customized applications in a few hours without writing any code and immediately realize an increased ROI with the right solution.
Frequently asked questions
Can I do data analytics without coding?
What is the difference between no-code and low-code analytics?
What types of data can I analyze with no-code tools?
Are no-code analytics tools secure enough for enterprise use?
How long does it take to build a dashboard with no-code tools?


Domo transforms the way these companies manage business.

