Enterprise Reporting: What It Is, Best Practices, and Examples
Enterprise reporting brings together data from finance, sales, marketing, and operations into one governed view that aligns with company-wide goals. This guide covers what enterprise reporting is, how it differs from traditional BI, the key features to look for in reporting software, and best practices for implementation that actually stick.
Key takeaways
Here are the main points to keep in mind as you build (or rebuild) enterprise reporting:
What is enterprise reporting?
Enterprise reporting is the process of consolidating business data from across an organization to develop reports, charts, and dashboards that inform strategic decision-making at every level.
A quick note on terminology: the phrase "enterprise reporting" carries two distinct meanings depending on context. In journalism, it refers to original investigative reporting generated by reporters rather than press releases. This article focuses on the business analytics meaning, where enterprise reporting is about turning cross-departmental data into actionable insights for decision-makers.
That distinction matters more than you might think. Enterprise reporting is not merely about gathering data to be reported on. It is the process of developing actionable reports that teams can use to drive their decisions. The difference between "data collection" and "decision enablement" is where most organizations stumble.
Enterprise reporting differs from traditional business intelligence (BI) and data analysis in that it focuses on high-level data that matters across an organization. It provides executives and individual contributors with data from across the organization that can help inform decisions for individual roles or departments.
Why is enterprise reporting important?
Every executive has experienced this frustration. You walk into a board meeting. Finance says revenue is up 12 percent. Sales claims 15 percent. Marketing has yet another figure entirely. Reconciliation debates eat the next 45 minutes instead of leaving time for strategic discussion.
Enterprise reporting replaces that chaos with a single, authoritative view of performance. An enterprise reporting system ensures all departments are working toward the same objectives by focusing on KPIs aligned with organizational goals. Because of this alignment, your team gets more collaboration, minimizes silos, and helps leaders track progress at a high level.
The result is timely board-ready reporting and reduced reliance on analyst intermediaries to reconcile conflicting data. Enterprise reporting drives efficiency and empowers decision-makers with timely and accurate information to identify trends, address risks, and create growth opportunities. By providing a holistic view of performance across departments, enterprise reporting helps businesses achieve goals and use their data to gain a competitive edge.
Benefits of enterprise reporting
An enterprise reporting system gives you a high-level view of your business. It gives everyone access to data from across the organization and ensures teams can benefit from data, no matter where it's created. Enterprise reporting can make your organization more efficient and keep everyone aligned.
Here are a few of the many additional benefits:
Who uses enterprise reporting tools?
Enterprise reporting serves a wide range of roles across an organization, each with distinct needs and priorities.
Executive leadership
Chief executive officers (CEOs), chief financial officers (CFOs), and chief operating officers (COOs) need reporting they can trust without reconciling conflicting numbers from different departments. Their primary use case is the board meeting and strategic review, where confidence in the data matters as much as access to it. Delays in consolidated reporting are a primary pain point for this group, as they often need to make time-sensitive decisions based on incomplete or inconsistent information.
This often extends to revenue leadership too (like a chief revenue officer), where pipeline, bookings, and recognized revenue need clear definitions so teams don't spend the quarter debating math instead of hitting targets.
Department managers and team leads
Line-of-business managers in sales, marketing, finance, and operations need self-service dashboards tailored to their department's KPIs. These people often struggle with overly technical dashboards and need analyst support to interpret them. What they need most is current data, department-specific views, and the ability to answer their own questions without waiting on IT or data teams.
Data and IT teams
IT leaders, data engineers, and BI managers are motivated by governance and scalability, not just reporting output. Their role is building the infrastructure that makes enterprise reporting trustworthy at scale. Centralized governance, secure data pipelines, and compliance tooling are the capabilities most relevant to this audience. They also need features that reduce tool sprawl and enable self-service reporting without sacrificing control.
This group often includes roles like a chief data officer (CDO) or IT director, where "governed enterprise reporting at scale" is the whole job description (whether anyone admits it out loud or not).
Business analysts
Analysts need automation that frees them from repetitive report builds so they can focus on higher-value analysis. Enterprise reporting gives them a governed foundation to work from, reducing the time spent on data validation and reconciliation.
Enterprise reporting vs business intelligence
Enterprise reporting is similar to business intelligence, but there are some important distinctions. The difference is primarily one of scope and governance orientation, not just tooling.
While both focus on bringing business data together and surfacing insights, business intelligence is more granular. Think about it as the process of uncovering all possible insights from your data. It is about diving deep into specific areas of your business, whether sales performance in one region or the engagement rate of a single marketing campaign. BI tools are designed to be flexible and exploratory, allowing you to analyze data at a granular level to answer specific questions or spot trends.
Enterprise reporting, on the other hand, gives more structure and shape to the data you're reporting on. Instead of focusing on every data point, it homes in on the information that aligns with your company's overall goals and priorities. Enterprise reporting emphasizes cross-departmental data and key performance indicators that measure success at a company-wide level.
Here's how the two approaches compare:
Because enterprise reporting is focused on high-level data and information with a larger impact across the whole company, it can help inform larger decisions and provide guidance on the more nuanced data business intelligence might surface.
Standard reporting vs enterprise reporting
Standard reporting typically serves a single team with a single data source. A marketing team might pull campaign metrics from their ad platform, or a sales team might generate pipeline reports from their customer relationship management (CRM) system. These reports answer department-specific questions but do not connect to the broader organizational picture.
Enterprise reporting differs in three key ways. First, it consolidates data across departments, bringing together finance, sales, marketing, operations, and customer service into a unified view. Second, it enforces governed metric definitions so that "revenue" means the same thing whether you're in accounting or sales. Third, it distributes reports to multiple stakeholder tiers simultaneously, from the CEO reviewing quarterly performance to the regional manager tracking weekly targets.
When to use enterprise reporting vs BI
Enterprise reporting and BI are complementary, not competing. The key is knowing when to use each.
A good way to use enterprise reporting would be helping a CEO prepare for a quarterly board meeting. Instead of presenting dozens of isolated insights from various teams, enterprise reporting consolidates the data into a cohesive narrative that reflects the company's overall health. This could include financial performance, operational efficiency, and customer satisfaction scores (all tied to the organization's strategic goals).
Another example: working toward a company-wide initiative, such as reducing costs or improving customer retention. Enterprise reporting can pull together relevant data from across departments, including finance, marketing, operations, and customer service, to provide a comprehensive picture of progress.
In both of these examples, BI tools still play a role by digging into the details. They provide the information to build the reports, while enterprise reporting ensures everyone is looking at the same big picture.
Use this simple decision framework to choose the right approach:
While both have valuable assets for your company, there will be times when either enterprise reporting or business intelligence might be the right approach:
How enterprise reporting works
Enterprise reporting follows a structured data flow that transforms raw information from across your organization into actionable insights. Understanding this process helps you identify where governance controls apply and where bottlenecks might occur.
The process moves through five key stages:
Some organizations also use data federation here, which means your enterprise reports can query data in a warehouse or data lake without copying it into yet another system. That can cut down on data duplication and reduce latency in your reporting pipelines.
If your platform supports content certification, you can clearly mark which datasets are approved for enterprise reporting, so people don't have to guess which table is the "right" one.
For high-volume reporting cadences, automation can take a lot of busywork off your team's plate. Think scheduled deliveries, trigger-based alerts, and workflow-based distribution that gets the right enterprise report to the right people at the right time.
Key features to look for in enterprise reporting software
When evaluating enterprise reporting tools, look for capabilities that reduce tool sprawl and enable self-service reporting without sacrificing governance. The right platform handles data integration, modeling, visualization, and distribution in one place, eliminating the overhead of managing multiple disconnected tools.
Data integration from multiple sources
Enterprise reporting software should connect to both cloud and on-premises data sources with prebuilt connectors that reduce custom engineering overhead. Look for support across databases, cloud applications, spreadsheets, and application programming interfaces (APIs). Data federation capabilities let you query data in place without replication, which is valuable for organizations with data spread across multiple warehouses or lakes.
If your environment has a long list of sources, connector breadth matters. For example, Domo Integration supports 1,000+ prebuilt connectors, which can speed up how quickly you get data into enterprise reporting without piling on custom engineering work.
Governed metrics layer
This is the single most important capability for enterprise reporting. A governed metrics layer (sometimes called a semantic layer) lets you define metrics once and use them everywhere. This ensures that "monthly recurring revenue" or "customer churn rate" is calculated consistently across every report and dashboard. Without this, you're back to reconciling conflicting numbers from different teams.
Some platforms also include dataset certification (often called content certification) so teams can quickly spot which datasets are approved as the single source of truth for enterprise reporting.
Custom dashboards and visualizations
Different stakeholders need different views of the same data. Look for tools that support role-based dashboards with interactive visualizations. Executives might need strategic dashboards with high-level scorecards, while analysts need the ability to drill down into details. The interface should be accessible to team members who aren't experienced with data tools.
If you have a distributed workforce, it's also worth checking for mobile-ready dashboards so people can access enterprise reporting from wherever work happens. Domo BI includes mobile-ready access across devices, which is handy when "desk time" isn't guaranteed.
Automation and scheduling
Manual report generation is a time sink that introduces errors. Enterprise reporting software should support automated data refreshes, scheduled report distribution, and alert triggers when metrics cross defined thresholds. Stakeholders get current information without requiring analyst intervention.
If you want to go a step further, workflow automation can also handle trigger-based reporting. For example, Domo Apps can schedule reporting deliveries and use anomaly detection to alert teams when a key metric deviates outside a defined range.
Permissions and access control
Enterprise buyers evaluate specific controls that go beyond basic permissions. Look for role-based access control (RBAC) that limits data access by job function, row-level security that restricts data visibility based on attributes like region or department, and comprehensive audit trails that log every access event.
These controls matter for compliance with frameworks like the Sarbanes-Oxley Act (SOX), the Health Insurance Portability and Accountability Act (HIPAA), and the General Data Protection Regulation (GDPR). Frame access control not just as a security feature but as a trust mechanism: the right people see the right data, and every access event is logged and auditable.
Predictive insights and trend analysis
Advanced enterprise reporting tools incorporate AI and machine learning capabilities for forecasting and anomaly detection. Natural language querying lets non-technical stakeholders generate ad hoc reports conversationally without Structured Query Language (SQL) or coding skills. Department managers waiting on analysts to answer basic questions? That bottleneck goes away.
If natural language querying is on your wish list, make sure you understand what's actually happening under the hood. In Domo BI, for instance, DomoGPT supports natural language querying so stakeholders can ask a question and get a governed answer based on approved metrics, not a random spreadsheet floating around in someone's inbox.
Embedded analytics for external enterprise reporting
If your "enterprise" includes customers, partners, or franchisees, your reporting needs might extend outside your company walls. In that case, embedded analytics becomes part of the enterprise reporting conversation.
Look for a solution that supports:
Domo Embed supports embedded analytics like this, and Domo Everywhere provides a framework for delivering secure, white-labeled reporting experiences at scale.
Implementing effective enterprise reporting
Setting up an enterprise reporting system in your organization starts with understanding what you'd like from your reporting and then making sure you have the reports and data to track, measure, and report on your goals. Here are some steps to help you get started:
If you're trying to reduce tool sprawl, a single platform approach can help. For example, the Domo Platform connects data ingestion, governance, dashboards, automation, and embedded analytics in one governed environment.
To ensure your enterprise reporting is meeting your needs, keep some of these best practices in mind:
Metric governance and the single source of truth
The most frequent failure in enterprise reporting is not technical. It is organizational. Different departments define the same metric differently, leading to conflicting numbers that erode trust in data-driven decisions.
Consider how "revenue" might be calculated across your organization. Finance might use recognized revenue per generally accepted accounting principles (GAAP). Sales might count bookings at contract signature. Marketing might include pipeline value weighted by probability. Each definition is valid for its purpose, but when these numbers appear in the same board presentation, confusion follows.
Metric governance solves this by establishing clear ownership and standardized definitions. The core elements include:
A governance council or committee that includes representatives from finance, operations, and IT can oversee this process. The goal is not bureaucracy. It is ensuring that when the CEO asks about revenue, everyone in the room is looking at the same number.
Types of enterprise reports
Enterprise reports generally fall into three categories based on their purpose and audience:
Understanding which type you need helps you set appropriate expectations for latency, governance, and distribution.
Financial performance reports
Build a report for your CFO to track revenue, expenses, and profit margins across the company. By consolidating financial data, leaders can identify underperforming areas and optimize resource allocation to improve profitability. Key metrics might include revenue by product line, earnings before interest, taxes, depreciation, and amortization (EBITDA) trends, cash flow projections, and budget variance analysis.
Customer analytics reports
To get an enterprise-level view of customers, you can put together a report with customer satisfaction scores, churn rates, and support ticket resolution times to ensure service options are meeting customer needs. Using this combined view of high-level customer data highlights trends across regions or departments, ensuring customer-facing employees will improve service quality. Track metrics like Net Promoter Score, customer lifetime value, and retention rates by segment.
Operations and supply chain reports
Use enterprise reporting to make operations run more smoothly. Track KPIs like production efficiency, equipment downtime, maintenance schedules, inventory levels, and supply chain performance. Use this report to get a comprehensive view and enable teams to optimize processes and reduce costs. For supply chain visibility, include supplier performance metrics, lead times, and inventory turnover rates.
Sales performance reports
Sales is a data-heavy area, and there are a lot of metrics to track. The key for enterprise-level reporting is choosing the data that will help executives make decisions about the company and its future. An enterprise sales report can look at total sales, regional performance, comparisons to historic performance, and product-specific trends. By identifying which areas or products are driving revenue, leaders can adjust strategies to maximize growth.
Compliance and security reports
Compliance and security teams can use enterprise-level reporting to track adherence to regulatory standards across the organization. Keeping track of all of this data in one report helps teams catch potential issues early.
For regulated industries like finance and healthcare, these reports require specific governance controls: audit trails that document every data access event, role-based access ensuring only authorized personnel view sensitive information, and certified datasets that provide an auditable chain of custody.
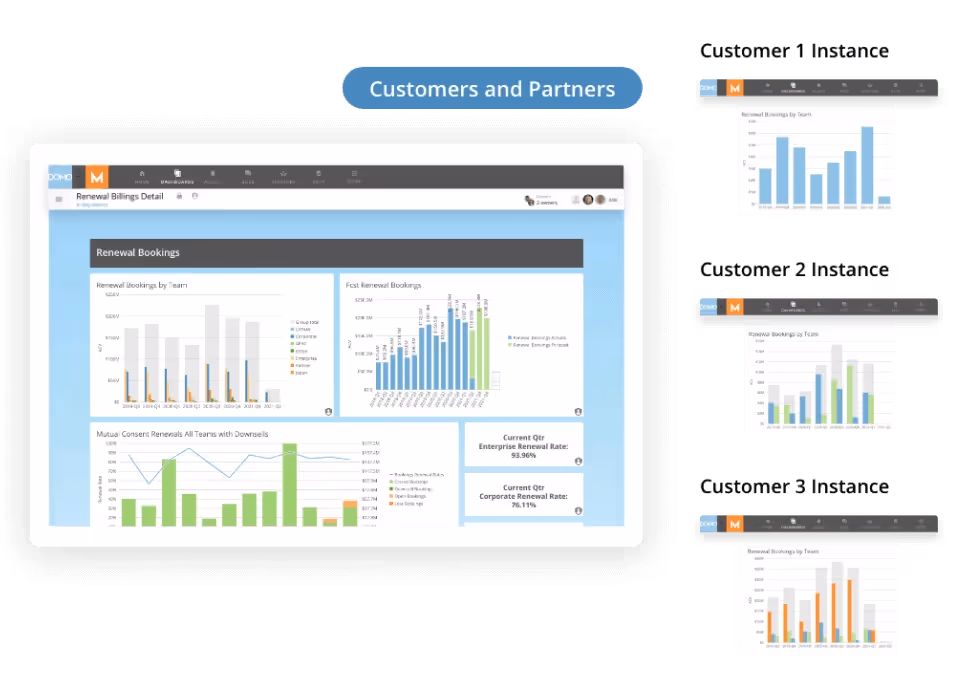
Embedded enterprise reporting for customers and partners
Sometimes enterprise reporting is not only for internal teams. If you offer a customer portal, partner dashboard, or platform experience, reporting can become part of your product.
An embedded enterprise reporting experience typically includes:
Tools like Domo Embed support white-labeled embedded analytics, and Domo Everywhere provides a framework for delivering this kind of reporting securely at scale.
Getting started with enterprise reporting
The right starting point depends on your role and priorities.
If you're an executive, focus first on getting a unified view of your most critical KPIs (the five to 10 metrics that drive board discussions and strategic decisions). The goal is confidence in the data, not just access to it.
If you're an IT or data leader, start with the infrastructure: a governed, scalable data platform that can serve as the single source of truth. Centralized governance and secure data pipelines are the foundation everything else builds on.
If you're a BI manager, look for a platform that consolidates your reporting stack. Managing multiple disconnected tools creates overhead and inconsistency. One platform that handles data integration, modeling, visualization, and distribution reduces total cost of ownership.
If you're an analyst, prioritize automation that frees you from repetitive report builds. The less time you spend on data validation and reconciliation, the more time you have for analysis that actually moves the business forward.
Incorporating an enterprise reporting solution like Domo can significantly enhance how your organization manages and analyzes data. Domo offers an all-encompassing tool that centralizes data from various sources, giving you the access you need to all your data to build customized reports that work for your whole business.
If you're mapping capabilities to specific needs, here's one simple way to think about it:
With Domo's intuitive dashboards and support of current data updates, your company will get deeper insights into your financial performance, customer behavior, operational efficiency, sales trends, and compliance metrics. Domo's enterprise reporting features empower decision makers across your teams to act swiftly and strategically.
Frequently asked questions
What is enterprise reporting?
How is enterprise reporting different from business intelligence?
What features should I look for in enterprise reporting software?
Who uses enterprise reporting tools?
How do I implement enterprise reporting effectively?
Can enterprise reporting be embedded into customer or partner portals?


Domo transforms the way these companies manage business.

