Business Intelligence Components: A Complete Guide for 2026
Business intelligence systems succeed or fail based on how well six core components work together, not on how polished the dashboards look. Data sources, integration, storage, analytics, visualization, and governance form the foundation of any BI environment worth trusting. This guide explains each component, shows how they connect in practice, and offers guidance for building a BI system that delivers consistent, reliable insights.
Key takeaways
Here are the main takeaways:
- Business intelligence systems rely on six core components working together: data sources, data integration, data storage, analytics, visualization, and governance.
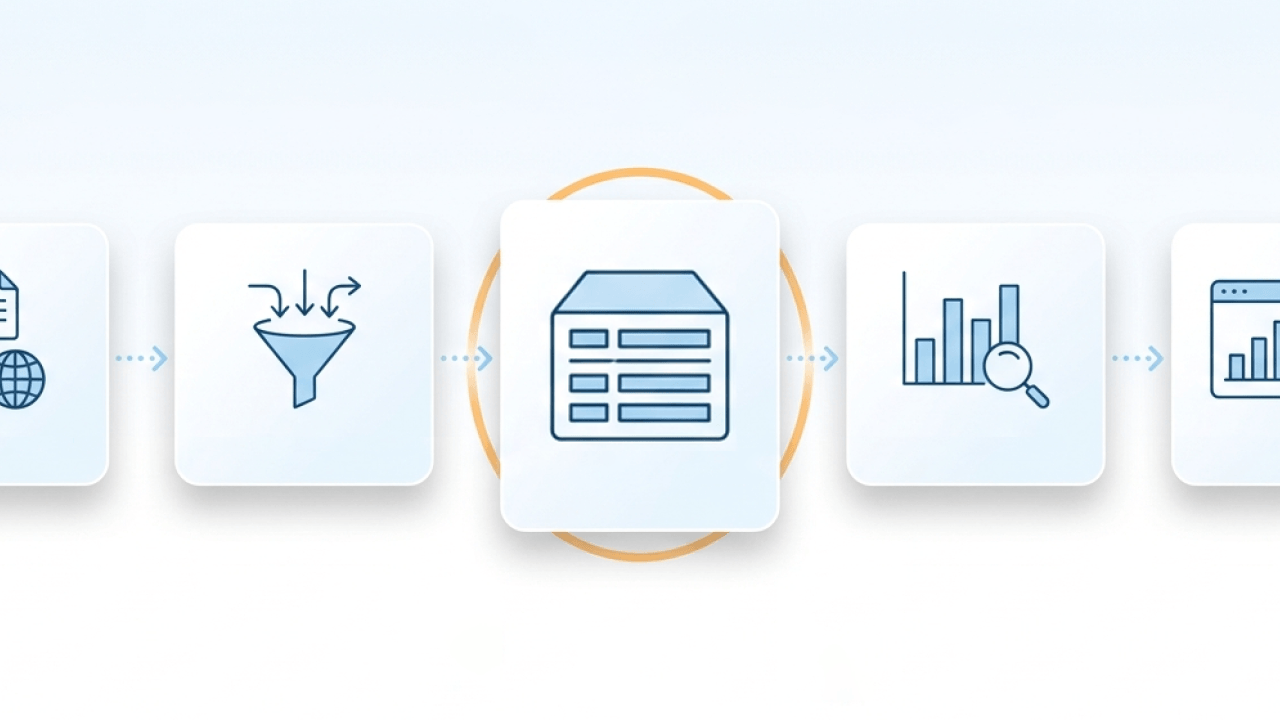
- The BI process runs in a loop: gather data, standardize it, analyze it, and share it in ways that drive decisions.
- Modern BI includes three main types (self-service, embedded, and real-time) each serving different organizational needs.
- AI is transforming BI by enabling conversational analytics, automated insights, and predictive capabilities built on governed data.
- BI implementations succeed when data, people, processes, and technology stay aligned.
What is business intelligence?
If you've ever watched teams argue over whose numbers are "right," you've already met the core problem BI is meant to solve.
Business intelligence is a set of strategies and technologies that gather data, interpret it, and transform it into actionable insights. BI uses a variety of tools, including data mining, charts and visualizations, business analytics, and performance benchmarking, to help executives make sound business decisions.
Organizations have more data than ever. But it often lives in disconnected systems, uses inconsistent definitions, and takes too long to turn into answers. That's the gap BI is designed to close. A well-designed BI environment brings data together into a single governed source so teams can move quickly without second-guessing what the numbers mean.
You may have encountered different frameworks describing BI components. Some list three parts, others four elements, still others five or six. These models aren't contradictory; they put the spotlight on different layers of the same architecture. The six-component model explored below is a practical, end-to-end view that maps cleanly to other frameworks while covering what a modern BI system actually needs.
Business intelligence vs. business analytics
These terms get used interchangeably, but they describe different parts of the data-to-decision spectrum.
Business intelligence focuses on descriptive analytics: what happened and why. BI tools help you understand historical performance, monitor current operations, and identify trends through dashboards, reports, and ad hoc queries. The goal is to give decision-makers a clear, accurate picture of the business as it exists.
Business analytics extends into predictive and prescriptive territory: what will happen and what should we do about it. BA applies statistical modeling, machine learning, and simulation to forecast outcomes and recommend actions. Think demand forecasting, customer churn prediction, or pricing optimization.
In practice, most organizations need both. BI provides the foundation (clean data, consistent metrics, governed access) that makes analytics possible. Without reliable BI infrastructure, predictive models are built on shaky ground. The distinction matters when you're evaluating tools or building a team: BI skills center on data modeling, visualization, and governance, while BA skills lean toward statistics, programming, and domain expertise.
Benefits of business intelligence
When the components play nicely together, the payoff is real:
- Timelier decisions: Instead of waiting days for an analyst to pull data, business people can answer questions in minutes through self-service dashboards. The time between a business question and a confident answer shrinks dramatically.
- Consistent metrics across teams: A governed semantic layer ensures that "revenue" means the same thing in the sales dashboard, the finance report, and the executive presentation. No more conflicting numbers in meetings.
- Reduced reliance on analyst intermediaries: Self-service access means line-of-business managers can explore data directly rather than submitting requests and waiting in queue. Analysts can focus on complex analysis instead of routine report generation.
- Improved operational efficiency: Automated data pipelines and real-time dashboards replace manual spreadsheet work, which frees teams to spend time on analysis instead of reformatting data.
- Clearer customer understanding: Unified customer data enables segmentation, personalization, and churn prediction that wouldn't be possible with fragmented systems.
- Data-driven culture: When insights are accessible and trustworthy, more people use data in their daily decisions. This compounds over time as data literacy spreads across the organization.
These benefits only materialize when the underlying components, especially data governance and data quality, are working correctly. A BI system with inconsistent metrics or unreliable data can make decisions worse by giving false confidence in flawed numbers.
The 6 core components of business intelligence
Dashboards get the glory, but they're the last stop on the journey.
Business intelligence is more than tools and dashboards. It is an ecosystem of integrated components that work together to turn raw data into actionable insight. Think of these as connected layers, not a shopping list. When one layer is shaky, everything downstream inherits the wobble.
Before diving into each component, it helps to understand what qualifies as a "component" in the first place. A BI component is a distinct functional layer of the BI environment, not a feature, not an outcome, not a tool. The six-component model maps to four categories:
- Data layers: sources and storage
- Process layers: integration and transformation
- Analytical layers: analysis and visualization
- Governance: policies, controls, and accountability that span all other layers
Some frameworks count three components, others four, still others five or seven. The differences come down to how granularly you slice the architecture. A four-component model might group sources, integration, and storage under "data infrastructure." A three-part model might combine analysis and visualization into "analytics." The underlying architecture is the same.
Here's a closer look at each core BI component:
Data sources
Start where the truth starts: the systems where work actually happens.
Data sources are the foundation of any BI environment. This includes everything from customer relationship management (CRM) and enterprise resource planning (ERP) systems to spreadsheets, cloud applications, and even social media feeds. The quality and reliability of your data sources directly impact the accuracy of your insights.
For data engineers and analytic engineers managing source diversity at scale, the challenge is not just connecting to sources. It is keeping those connections reliable as data volumes grow and source systems change. One flaky integration can cascade into broken dashboards and mistrust. Fast.
And honestly, that's the part most guides skip over: deciding which system is authoritative for each domain (customers, products, orders) early. "We'll sort it out later" usually turns into years of reconciliation.
Data integration and ETL
This is where raw data either becomes usable or becomes chaos.
Once you've identified your data sources, the next step is integrating that data so it's secure, consistent, and accessible. This often involves ETL (extract, transform, load) or ELT (extract, load, transform) processes that combine data into a unified format.
The difference between ETL and ELT matters for your architecture:
- ETL transforms data before loading it into your warehouse. This approach works well when you need to clean and structure data upfront, particularly when storage costs are a concern or when your warehouse has limited processing power.
- ELT loads raw data first, then transforms it inside the warehouse. This pattern has become more common with modern cloud warehouses that offer abundant compute power, allowing analysts to iterate on transformations without re-extracting data.
Many teams turn this into a philosophical debate instead of an operational choice. Pick a pattern you can run consistently, monitor, and explain when something breaks.
Reliable integration requires more than just moving data. Here's a practical checklist for ETL/ELT pipelines:
- Validation rules: Define checks for data types, required fields, and business logic (e.g., order amounts can't be negative) before data enters the warehouse.
- Freshness service-level agreements (SLAs): Set explicit expectations for how current data needs to be. Finance might need daily refreshes; operations might need hourly.
- Change data capture (CDC): For high-volume sources, capture only what changed rather than reloading entire tables. This reduces processing time and catches updates faster.
- Error handling: Build in retry logic, alerting, and quarantine tables for records that fail validation. Silent failures are how dashboards go stale without anyone noticing.
- Transformation ownership: Document who owns each transformation and where the logic lives. Splitting business logic across the pipeline, the warehouse, and the dashboard is how you end up debugging the same metric in three different tools.
In many BI environments, ingestion is its own operational reality. If you're pulling from hundreds of apps and databases, the workflow often looks like "connect, schedule, monitor, repeat." That monitoring is what keeps downstream business intelligence components from going stale.
Transformation is also where your BI system earns trust, or loses it. When customer records arrive from multiple sources with different formats, transformation logic deduplicates them, normalizes addresses, and converts currencies so downstream reports reflect a single, accurate view of each customer. The failure mode to watch for: splitting business logic across too many places (a bit in the pipeline, a bit in the warehouse, a bit in a dashboard). That's how you end up debugging the same metric in three different tools.
Many organizations also implement a semantic layer (sometimes called a metrics layer) that sits between transformation and visualization. The semantic layer defines business logic, including what "revenue" means, how "churn rate" is calculated, and which filters apply, so every dashboard and report uses consistent definitions. Treat metric definitions like product code, with clear ownership and change control. Let it become a modeling playground with no owners, and you will regret it.
Data warehousing and storage
Storage is where good intentions go to live, or to get buried.
While standardization ensures consistency and quality, data warehousing provides the backbone for efficient storage. A data warehouse serves as a centralized hub where standardized data is securely stored, enabling people to run queries and generate reports without disrupting operational systems.
In some cases, organizations complement data warehouses with data marts, which are smaller, specialized repositories tailored for specific departments or use cases. Whether using a large-scale warehouse or a focused data mart, these storage solutions ensure standardized data is secure, well-organized, and accessible for analysis, visualization, and dashboarding.
The easy mistake is "dump everything in and we'll model later." Without basic modeling conventions and ownership, you get a lake of mystery tables that nobody wants to touch. Organizations increasingly use data lakehouses, which combine the flexibility of data lakes with the governance structure of warehouses. This hybrid approach lets teams store both structured and unstructured data while maintaining the query performance and management controls BI workloads expect.
Choosing the right storage pattern depends on your use case:
- Finance reporting: Data warehouse with star schema modeling. Finance needs consistent, auditable data with clear lineage. The semantic layer enforces metric definitions (revenue recognition, period boundaries), and query performance matters for month-end close.
- Product analytics: Lakehouse or warehouse with event-based modeling. Product teams often need flexibility to explore behavioral data about people that doesn't fit neatly into predefined schemas. A lakehouse handles semi-structured event data while still supporting governed metrics.
- Operational real-time: Lakehouse with streaming ingestion or a dedicated real-time layer. Operations dashboards that need sub-minute freshness require different infrastructure than weekly finance reports. Consider whether "real-time" means minutes or seconds.
Your storage choice affects semantic layer complexity, query performance, and how much governance overhead you'll carry. A data mart simplifies governance for a single team but creates silos if overused.
Data analysis and mining
Here's where curiosity meets math.
With your data standardized and stored, you can dive into analysis and mining. This is where you start uncovering trends, identifying patterns, and revealing hidden opportunities within your data. Techniques include OLAP (online analytical processing), predictive modeling, and other advanced analytics methods that help you move from "what happened" to "what's next."
Effective BI analysis depends not just on running queries but on having well-defined, consistently governed metrics. The key performance indicator (KPI) lifecycle, which includes define, validate, publish, monitor, and revise, keeps the numbers your organization tracks aligned with how the business actually operates. A metric definition should include its calculation, grain (daily, weekly, monthly), refresh cadence, and owner so that everyone interprets it the same way.
This is also where AI can be genuinely helpful: forecasting, correlation, and anomaly detection work best when they're grounded in certified definitions from your semantic layer. Otherwise you're just automating arguments. Sanity-check "interesting" correlations against context before you ship them to an executive dashboard. That step gets skipped more than it should.
For analysts and BI specialists, advanced analytics capabilities like forecasting and statistical modeling represent the work you actually want to spend time on.
Reporting and visualization
If analysis stays in a notebook, it doesn't change anything.
Analysis alone doesn't drive decisions. Clear reporting and visualization do. BI tools transform complex data into charts, graphs, dashboards, and scorecards so leaders can understand the story behind the numbers and act with confidence.
Modern BI platforms push reporting further with interactive dashboards that deliver real-time insights into performance metrics, key performance indicators (KPIs), and historical trends. These dashboards can be tailored: executives track strategic objectives, while marketers monitor campaign results with precision. Dashboard sprawl is the misuse to watch for. Dozens of slightly different dashboards answering the same question in slightly different ways. That's not insight; it's noise.
Effective visualization components are designed for the full spectrum of people, not just technical analysts. Line-of-business managers and othernon-technical people who still need daily dataneed self-service access to role-appropriate dashboards rather than waiting for analyst-built reports. Self-service doesn't mean ungoverned. Reliable visualizations depend on a governed metrics layer upstream where KPI definitions are certified and consistent across every report and dashboard. If people can't tell which metric is the "official" one, they won't trust any of them.
True self-service requires a stack of prerequisites working together:
- Semantic layer: Metrics defined once, with clear ownership and versioning
- Certified datasets: Data sources marked as trustworthy and ready for analysis
- Role-based access: People see only the data they're authorized to access
- Documentation: Data catalog entries, metric definitions, and usage guidance that help people find and understand available data
Without these prerequisites, self-service becomes self-sabotage.
BI systems also support scheduled delivery of reports to stakeholders. When routine reporting runs on autopilot, analysts spend less time acting like a report factory and more time doing the interesting work.
On top of dashboards and static exports, many teams rely on alerts when something changes. If a KPI spikes, drops, or drifts outside a threshold, automated notifications help the right people act while the moment still matters. Tune the thresholds poorly, and you'll train everyone to ignore the noise within a month.
Data governance and security
Governance is the part nobody brags about, until it's missing.
Data governance is not just a best practice. It's a core BI component that determines whether your insights can be trusted. Governance encompasses the policies, processes, and controls that ensure data quality, security, and compliance across your BI environment.
Effective governance requires a clear operating model with defined roles:
- Data owner: Business leader accountable for a data domain (e.g., VP of Sales owns customer data). Makes decisions about data definitions, access policies, and quality standards.
- Data steward: Hands-on practitioner who implements governance policies, maintains documentation, and resolves data quality issues. Often sits within the business unit.
- BI admin: Technical role managing platform configuration, access, and system performance. Ensures governance policies are enforced at the platform level.
- Domain analyst: Power person who creates reports and dashboards within their area. Responsible for following governance standards and flagging issues.
Key governance artifacts include:
- Data catalog: A searchable inventory of your data assets, including descriptions, owners, and classification (personally identifiable information, confidential, public). The catalog enables discovery while controlling who can access what.
- Business glossary: Standardized definitions for business terms and metrics. When "active customer" means the same thing to Sales, Marketing, and Finance, meetings get shorter.
- Data lineage: The ability to trace data from its source through transformations to final reports. Lineage is essential for auditing, troubleshooting, and understanding how sensitive data flows through your systems.
- Access controls: Role-based access control (RBAC) assigns permissions based on job function, while row-level security restricts which records people can see based on attributes like region or department. These controls ensure people see only the data they're authorized to access.
- Certification workflows: A tiered trust model for datasets and reports. Certified assets have been validated and approved for broad use. Promoted assets are in review. Draft assets created by people are exploratory and not yet governed. This hierarchy helps people know which numbers to trust.
Some platforms support more granular policies that act like a governed control plane for the whole BI stack. For example, personalized, row-level permissions can follow the data into every downstream business intelligence component (dashboards, reports, alerts, and AI-driven experiences) without you re-implementing rules in three different tools. Managing permissions ad hoc per dashboard is the pattern that looks fine until it doesn't, and then you're auditing access in a panic.
Data quality dimensions provide a framework for measuring trustworthiness:
- Freshness: How recently was the data updated?
- Completeness: Are required fields populated?
- Consistency: Do values match across systems?
- Referential integrity: Do relationships between tables hold?
Measurable governance controls help you track whether governance is working:
- Freshness SLAs: Percentage of datasets meeting their defined refresh targets
- Quality scores: Automated checks for completeness, consistency, and validity
- Certified dataset adoption: Percentage of reports built on certified vs. uncertified data
- Time-to-certify: How long it takes to move a new dataset from draft to certified
Compliance alignment matters for regulated industries. Governance controls should map to standards like Service Organization Control 2 (SOC 2), the Health Insurance Portability and Accountability Act (HIPAA), and the General Data Protection Regulation (GDPR), with audit logs that track who accessed what data and when.
For IT and data leaders, governance is the mechanism that enables self-service without sacrificing control.
How business intelligence works
Knowing the parts is useful. Watching them interact is where BI clicks.
The BI process follows a cyclical flow that transforms raw data into decisions and then feeds learnings back into the system.
The BI workflow from data to decisions
Here's what the end-to-end flow looks like in practice:
- Collect data from sources: Sales records from your CRM, product data from your ERP, web traffic from analytics platforms, and external data like market benchmarks all flow into the system. Governance checkpoint: certify which source is authoritative for each domain.
- Integrate and transform via ETL/ELT: Data is extracted, cleaned, deduplicated, and standardized. A customer record appearing in three systems becomes one trusted record with consistent formatting. Governance checkpoint: validate transformations against data quality rules before loading.
- Store in a governed repository: Transformed data lands in a data warehouse or lakehouse, organized into schemas that support efficient querying (often a star schema with fact and dimension tables). Governance checkpoint: apply access controls and document data assets in the catalog.
- Apply metric definitions via a semantic layer: Business logic is defined once, for instance "Revenue equals sum of sales amount, excluding returns, at daily grain," so every downstream consumer uses the same calculation. Governance checkpoint: certify metrics and assign owners.
- Analyze and explore: Analysts run queries, build OLAP cubes, and apply statistical models to uncover patterns and answer business questions. Governance checkpoint: ensure analysis uses certified datasets and governed metrics.
- Visualize and distribute: Insights become dashboards, reports, and alerts tailored to different audiences. Executives see strategic KPIs; operations teams see real-time metrics. Governance checkpoint: enforce role-based access so people see only authorized data.
- Act on insights: Decisions are made, whether that means adjusting pricing, reallocating marketing spend, or addressing a supply chain issue. The results flow back into source systems, starting the cycle again.
People sometimes treat this like a straight line with a finish date. It isn't. The loop only works when steps four through seven feed back into earlier assumptions: definitions, data contracts, even which sources you trust.
A concrete example: Imagine a retail company asking, "Why did Q3 sales drop in the Midwest?" Data flows from the CRM and point-of-sale (POS) systems through an automated pipeline that deduplicates transactions and normalizes product categories. The warehouse stores this in a star schema with factsales joined to dimstore, dimproduct, and dimdate. The semantic layer defines "same-store sales" consistently. An analyst queries the data, discovers that a key product was out of stock at several locations, and surfaces this in a dashboard. The operations team sees an alert, investigates, and fixes the supply chain issue.
Types of business intelligence
Not every organization uses BI the same way. The implementation model depends on who needs data, how fast they need it, and where they'll consume it.
Three types dominate modern BI environments, and most organizations end up using some combination of all three.
Self-service business intelligence
Self-service BI puts data exploration directly in the hands of business people. Instead of submitting a request to an analyst and waiting days for a report, a marketing manager can build their own dashboard, filter by campaign, and drill into conversion rates.
The promise is democratization: more people making data-informed decisions without bottlenecks. The risk is chaos. Conflicting metrics. Ungoverned data. Dashboards that contradict each other.
Self-service works when the underlying infrastructure supports it. That means a semantic layer with certified metrics, a data catalog so people can find trustworthy data, role-based access controls, and enough documentation that people know what they're looking at.
Embedded business intelligence
Embedded BI integrates analytics directly into the applications people already use. Instead of switching to a separate BI tool, people see dashboards, charts, and insights inside their CRM, customer portal, or internal operations platform.
This approach is common for organizations serving external customers. A software company might embed usage analytics into their product so customers can track their own performance. A logistics provider might give shippers visibility into delivery metrics through a branded portal.
Embedded BI requires the same governance as internal BI, often more, since you're exposing data to external people. Row-level security becomes critical: each customer should see only their own data, and that permission model needs to follow the data into every embedded view.
Real-time business intelligence
Real-time BI delivers insights as events happen, not hours or days later. Operations teams monitoring production lines, fraud analysts watching transaction patterns, and customer support managers tracking queue times all benefit from dashboards that update in seconds or minutes rather than overnight.
The infrastructure requirements differ from traditional batch BI. Real-time BI often involves streaming data pipelines, change data capture, and storage layers optimized for low-latency queries. Not every use case needs this. Weekly finance reports don't benefit from sub-second freshness. But for time-sensitive decisions, the investment pays off.
The governance challenge with real-time BI is ensuring that speed does not compromise accuracy.
BI tools and platforms
The BI tool landscape gets noisy quickly. A simple way to cut through it is to map tools to the component they serve.
Here's how common tools map to BI components:
- Data integration: Domo, Fivetran, Airbyte, Stitch, Talend, and Informatica handle extraction and loading from source systems, though point tools still require separate products for the rest of the BI stack.
- Data transformation: Domo, dbt, Dataform, and Matillion focus on the transformation layer, often running inside the warehouse, though teams still need other tools to cover the rest of the BI stack.
- Data storage: Snowflake, BigQuery, Redshift, Databricks, and Azure Synapse provide warehouse and lakehouse capabilities, though organizations still need separate tools for other BI components.
- Semantic layer: dbt Metrics, LookML (Looker modeling language), Power BI semantic models, and AtScale define business logic and metric consistency, though teams often need added tooling to cover the rest of the BI workflow.
- Visualization: Domo, Tableau, Power BI, Looker, Qlik Sense, and Metabase turn data into dashboards and reports, though most teams still need separate tools for integration, transformation, and governance.
- Governance: Alation, Collibra, Atlan, Monte Carlo, and Great Expectations handle cataloging, lineage, and quality monitoring, though teams still need other products to manage the rest of the BI stack.
Some popular tools emphasize one slice of the stack. Tableau is often centered on visualization, while platforms like ThoughtSpot focus on search-style, natural language analytics. Those approaches can work well, but you still need to account for ingestion, transformation, governance, and metric consistency somewhere else. Usually with more tooling and more coordination than teams expect.
When comparing platforms, this matrix highlights key differentiators:
When evaluating tools, consider these selection criteria:
- Data volume and latency requirements: Real-time dashboards need different infrastructure than weekly batch reports.
- Governance needs: Regulated industries require strong access controls, audit logs, and compliance documentation.
- Self-service vs. centralized model: Some organizations want analysts to control all reports; others want business teams to build their own.
- Existing technology stack: Tools that integrate with your current cloud provider and data infrastructure reduce complexity.
- Total cost of ownership: Consider not just license fees but also implementation, training, and ongoing maintenance.
Point solutions like Tableau for visualization or Snowflake for storage require organizations to assemble and govern multiple tools separately.
Best practices for an effective BI environment
You can buy plenty of tools and still end up with a brittle BI environment. The difference is the discipline you build around the components.
Effective BI requires alignment across three dimensions: people, process, and platform. Tools alone do not create value.
Start with governance, not visualization. It's tempting to jump straight to dashboards, but without governed data sources and consistent metric definitions, you'll build on a shaky foundation. Establish a semantic layer or certified metrics standard early so that every report uses the same business logic.
Design for your full spectrum of people. Data engineers need pipeline reliability and clear data contracts. Analysts need reusable metrics and the ability to explore data deeply. IT leaders need governance without bottlenecks. Line-of-business people need self-service access that does not require SQL skills. A successful BI environment serves all these needs, not just the most technical people.
Invest in data quality monitoring. Automated checks for freshness, completeness, and consistency catch problems before they reach dashboards. A subtle but real failure mode is monitoring pipelines while ignoring business-level checks (like "orders can't be negative"). You need both to keep BI trustworthy.
Document metric definitions explicitly. Every KPI should have a documented calculation, grain, filters, refresh cadence, and owner. This documentation prevents the "what does this number mean?" conversations that erode trust in BI systems.
Assign clear ownership. Every data domain needs an owner accountable for quality and definitions. Every certified dataset needs a steward who maintains it. Every dashboard needs someone responsible for keeping it accurate and relevant. Governance without ownership is just documentation that nobody reads.
Build for iteration, not perfection.
Measure adoption, not just deployment. A dashboard that nobody uses provides no value. Track which reports get viewed, which metrics get queried, and where people get stuck.
Common mistakes in business intelligence implementation
BI projects rarely fail for lack of ambition. They fail in the boring places.
While business intelligence can be extremely beneficial to companies, there are mistakes that undermine BI initiatives. Organizing these by component layer makes them easier to spot and fix.
Integration mistakes
Integration failures often cascade into every downstream component.
- Schema drift without detection: Source systems change their data structure, and your pipeline keeps running without noticing. Detection signal: dashboards suddenly show nulls or unexpected values. Fix: implement schema validation and alerting on source changes.
- Missing freshness SLAs: Nobody defined how current data needs to be, so a pipeline that's three days stale goes unnoticed. Detection signal: people complain that numbers don't match what they see in source systems. Fix: set explicit freshness targets and monitor against them.
- Transformation logic scattered everywhere: Business logic lives partly in the pipeline, partly in the warehouse, partly in dashboard calculations. Detection signal: you're debugging the same metric in three different tools. Fix: centralize transformation logic in one layer with clear ownership.
Modeling mistakes
Modeling mistakes create the "whose numbers are right?" arguments that erode trust.
- Metric drift: The same KPI is calculated differently across teams. Sales says revenue is $10M; Finance says $9.2M. Detection signal: conflicting numbers in executive meetings. Fix: define metrics once in a semantic layer with certified ownership.
- Duplicate definitions: Three different "active customer" definitions exist because nobody checked what already existed. Detection signal: data catalog shows multiple metrics with similar names. Fix: require catalog search before creating new metrics.
- Ungoverned KPIs: Metrics exist but have no owner, no documentation, and no validation. Detection signal: nobody can explain how a number is calculated. Fix: assign owners and require documentation for certification.
Visualization mistakes
Visualization mistakes turn insights into noise.
- Dashboard sprawl: 15 dashboards answer the same question in 15 slightly different ways. Detection signal: people don't know which dashboard to trust. Fix: consolidate to canonical dashboards, archive duplicates, and require justification for new dashboards.
- Uncertified reports in production: Exploratory dashboards get shared broadly before they're validated. Detection signal: executives make decisions based on draft reports. Fix: implement certification tiers and restrict sharing of uncertified content.
- Access misconfiguration: People see data they shouldn't, or can't access data they need. Detection signal: access audit reveals unexpected permissions. Fix: implement role-based access at the platform level, not per-dashboard.
Data quality issues
Data quality problems usually start with not understanding what kind of data you're dealing with.
When gathering data for business intelligence, it is important to understand the three main types of data:
Structured data is organized in a predefined format, typically stored in a database, making it easy to access and analyze.
Unstructured data lacks a predefined format and includes things like emails, social media posts, and images.
Semi-structured data falls between structured and unstructured, with examples including Extensible Markup Language (XML) and JavaScript Object Notation (JSON) files.
Understanding these data types and how to gather and analyze them effectively is crucial for businesses.
Data that lacks freshness, completeness, referential integrity, or consistency will produce unreliable insights regardless of how sophisticated your analysis tools are. Sophisticated tools applied to bad data don't produce solid answers. They produce confidently wrong ones.
Process and adoption failures
Even with good data, process issues can stall a BI environment.
Several process-related mistakes commonly derail BI initiatives:
- Not gathering data from all relevant sources: In order to make accurate decisions, companies need to gather data from all relevant sources. This includes internal data sources like financial reports and customer databases as well as external data sources like news articles and social media posts.
- Not cleaning or standardizing the data: Once the data has been gathered, it needs to be cleaned and standardized. This includes things like removing duplicates, standardizing formats, and filling in missing values.
- Not defining consistent metrics: When different teams calculate the same metric differently, conflicting reports erode trust in the entire BI system.
- Not empowering people to use data: In order for business intelligence to be successful, people need to be empowered to use data to make decisions. This includes training people on how to use the BI system, giving them access to the data, and encouraging them to use data when making decisions.
You can avoid many of these mistakes by taking the time to develop a strategic business intelligence environment that addresses data, people, processes, and technologytogether. One telltale sign you're on the right track: when a new question comes up, you can answer it by extending the system, not by starting over in a spreadsheet.
BI use cases
Same components, different shape, depending on the problem you're solving.
BI components come together differently depending on the business problem. Here are examples that illustrate how the components work in practice:
Sales pipeline visibility: A business-to-business (B2B) company connects CRM data (data sources) through an automated pipeline (integration) into a warehouse (storage) where opportunity stages are standardized. A semantic layer defines "qualified pipeline" consistently, and sales managers access a dashboard (visualization) showing pipeline by rep, region, and product. Governance ensures reps see only their own opportunities while managers see their full team.
Marketing attribution: A consumer brand integrates web analytics, ad platform data, and CRM records to understand which campaigns drive conversions. The transformation layer handles cross-device identity resolution and attribution modeling. Dashboards show marketing ROI by channel, and alerts notify the team when cost-per-acquisition exceeds thresholds. Attribution is also where definition drift happens easily, so teams tend to get clearer results when they lock down a small set of agreed-upon models instead of letting every channel report "its" version.
Operational efficiency: A logistics company monitors delivery performance in near-real-time. Data streams from GPS devices and warehouse systems into a lakehouse, where transformations calculate on-time delivery rates by route and driver. Operations managers see dashboards with drill-down capability, and anomaly detection flags routes that suddenly underperform.
Financial forecasting: A retail chain combines historical sales data with external factors like weather and economic indicators to predict demand. The analysis layer applies statistical models, and finance teams access forecasts through governed reports that show assumptions and confidence intervals. Row-level security ensures regional managers see only their markets. Forecasts also need a feedback loop. If you don't compare predicted vs. actual and adjust, "forecasting" turns into a fancy way to repeat last quarter.
The future of business intelligence
BI is shifting from "pull reports" to "insights find you."
The most significant change in BI over the next few years isn't a new chart type or a faster database. It's the integration of AI throughout the stack, and the governance challenges that come with it.
Conversational analytics is moving from novelty to expectation. Instead of building a dashboard, people ask questions in plain language: "What drove the revenue drop in the Northeast last month?" AI interprets the question, queries the right data, and returns an answer. This works well when the underlying infrastructure is solid. It fails spectacularly when it is not.
Here's where I've seen this go sideways: AI-powered BI features are only as trustworthy as the metric definitions and access controls underneath them. A natural language query that pulls from ungoverned data or calculates metrics on the fly can surface inconsistent or hallucinated numbers. The semantic layer becomes even more critical in an AI-enabled environment. It's the contract that tells the AI what "revenue" means, which filters apply, and which data sources are authoritative.
Automated insights are another frontier. Instead of waiting for someone to notice a trend, AI surfaces anomalies, correlations, and opportunities proactively. A dashboard might highlight that a product category is underperforming in a specific region before anyone asks. Alert fatigue is real, though. If the AI surfaces too many "insights" that aren't actionable, people learn to ignore it.
Agentic AI takes this further. Rather than just surfacing insights, AI agents can take action, triggering workflows, updating records, or escalating issues based on what the data shows. This requires even tighter AI governance: you need to trust not just the data but the logic that determines what the agent does with it.
For organizations building BI environments today, the implication is clear: invest in governance infrastructure now. The semantic layer, data catalog, certification workflows, and access controls that enable reliable self-service BI are the same components that enable reliable AI-powered BI.
How Domo supports a more effective BI environment
Good BI is not just "more tools." It is fewer seams between the components.
Building an effective business intelligence environment requires the right infrastructure, processes, and tools.That's where Domo comes in.
Unlike fragmented multi-tool stacks that require organizations to assemble and govern separate solutions for ingestion, transformation, storage, visualization, and governance, Domo provides all core BI components under a single governed platform. This architectural completeness means:
- IT and data leaders get enterprise-grade security with RBAC, Personalized Data Permissions (PDP), row-level security, single sign-on (SSO) integration, audit logs, visual data lineage, and compliance certifications (SOC 2, HIPAA, GDPR) built into the platform rather than bolted on.
- Analysts and BI specialists work with certified metrics and reusable logic through Domo's Certified Metrics and semantic layer, eliminating the "multiple versions of truth" problem.
- Line-of-business managers and other non-technical people can ask plain-English questions with AI Chat and get instant answers grounded in governed data and certified definitions, without filing a ticket or waiting in a queue. Because AI Chat queries the semantic layer, it returns consistent metrics rather than hallucinated calculations.
- Line-of-business executives stay on top of performance with Dynamic Dashboards and AI-powered alerts that call out KPI changes as they happen.
- Data engineers connect to over 1,000 pre-built connectors and build reliable pipelines with built-in data quality monitoring. For teams juggling many source systems, that breadth reduces connector sprawl and the long tail of one-off integrations that quietly break on a Tuesday morning.
- Analytic engineers can prep and enrich data with Magic Transformation (structured query language [SQL]-based and no-code ETL/ELT), then trace issues end to end with lineage.
- Teams can automate routine distribution with Scheduled Reports Delivery, so stakeholders get the right report on the right cadence.
- Organizations that need embedded analytics can use Domo Embed, with the same governed metrics, permissions, and AI Chat available inside embedded experiences.
From data collection to decision-making, Domo helps teams access clean, centralized data, visualize insights quickly, and act with confidence. If you're just getting started, the platform keeps the basics consistent; if you're already mature, it helps you tighten governance and reduce handoffs across the stack.
Ready to see it in action? Watch a demo or try Domo for free today.
Frequently asked questions
What are the 5 stages of business intelligence?
What are the 4 elements of a business intelligence environment?
What is a semantic layer in business intelligence?
How do I choose the right BI tools for my organization?
What is the difference between business intelligence and business analytics?


Domo transforms the way these companies manage business.

