Analytics vs Reporting: Differences and Examples


Data powers informed decision-making. But are you making the most of it? How you interpret data and respond to the information can determine business success. This is where two essential approaches to handling—reporting and analytics—come into play. While interconnected, they serve distinct roles in the data lifecycle, varying based on the approach, tools, and goals.
Whether you’re setting up dashboards to monitor performance or using advanced analytics to predict trends, knowing these differences will help your organization to move from reactive to proactive data strategies. Here’s how reporting and analytics differ and why both are essential.
Key differences between reporting and analytics
Reporting answers the “what” by summarizing past data in a structured, defined, and easily understandable format. Analytics addresses the “why” and “what’s next,” using statistical methods and models to perform deep dives on data and derive actionable insights.
What is reporting?
Reporting involves organizing data into structured formats, including dashboards, tables, spreadsheets, and visual elements like graphs and charts. Companies primarily use reporting to provide a clear and concise overview of past events. For businesses, this often includes metrics such as sales performance, customer retention, marketing campaign performance, and operational efficiency. Reporting tools aggregate raw data and display it in an understandable format, ensuring that stakeholders have the information they need to complete routine parts of their jobs, like monitoring, compliance, or aggregate tracking.
Reporting is designed to answer the question, “What happened?” For reporting to work effectively, it needs to be organized: Teams need to know when to expect reports, what to expect from them, and how to interpret them. Reporting comes at regular cadences and helps teams get an accurate picture of what has happened at their company.
What is analytics?
Complementing data reporting, analytics goes beyond graphs and charts to examine data and identify trends, outliers, correlations, and opportunities. Companies apply advanced techniques, like statistical modeling, machine learning, and additional data visualization methods, to gain meaningful insights. Analytics seeks to answer questions such as why certain trends occur, what factors influence outcomes, and how businesses can improve for better results.
While reporting aims to provide structure and interpretation for your data, analytics focuses more on deriving meaning and insights from your data. This is valuable for any organization and why analytics requires more knowledge and expertise to manage. Because analytics often requires specialized tools and expertise, it becomes a dynamic and strategic component of decision-making.
Types of reports and analytics
Let’s look at what this means in the everyday world of business. How are companies using reporting or analytics today? Reports vary depending on your company, goals, and the information you want to track. There isn’t one report that meets every need, and reports function best when they’re designed with specific goals in mind and answer specific questions. These can be questions like:
- Who are our most valuable customers, and what drives their loyalty?
- Which products or services generate the highest revenue, and through which channels?
- How effective are our marketing campaigns at converting leads into paying customers?
- Where are the bottlenecks in our processes, and how can we improve efficiency?
- Are we staying within budget while achieving our revenue goals?
- Which teams or individuals are exceeding their performance targets, and why?
- Are there emerging risks in our operations or compliance that need immediate attention?
- What are the most common customer complaints, and how quickly are we resolving them?
- What trends in customer feedback suggest opportunities for new products or features?
- What does our year-over-year growth look like, and how does it align with our long-term goals?
When you look at the different types of reports and analytics, you can carve them up in a lot of different ways. Below, we’ve organized the examples based on who a report might be intended for and the general business functions that a report and its associated analytics might address.
Types of reports
Reports by audience
- Executive reports provide high-level summaries tailored for C-suite executives and senior stakeholders. These reports highlight key metrics like ROI, progress toward company-wide goals, and major performance trends. They aim to deliver strategic insights in a concise format, enabling executives to make informed decisions without delving into operational details.
- Department heads and senior managers will need their own reporting. These reports provide actionable insights on team performance, campaign success, and operational efficiency. They help leaders align their department’s efforts with broader organizational goals and identify areas that need improvement.
- Team leader reports focus on specific project or campaign-level updates. These reports often include metrics on individual and team productivity, as well as progress on specific initiatives. They allow leaders to assess performance, address challenges, and adjust tactics to achieve their objectives.
- Reports for individual contributors provide detailed, real-time data relevant to their specific roles. These often take the form of dashboards that track metrics such as website visits, campaign engagement, or sales outreach efforts. Contributors use these insights to refine their daily tasks and optimize their impact.
Reports by business function
- Strategic reports include metrics from across the organization. They’re typically for high-level executives and provide data on the organization’s current performance relative to its goals. Some examples and what they can do include:
- Quarterly business reviews (QBRs): These track enterprise-level progress toward annual goals, provide a comprehensive view of organizational performance, and identify priorities for the coming months. They are shared with executives and leadership teams to facilitate alignment and recalibration.
- Annual reports: These provide a year-end review of business performance, offer comparisons over time and detailed ROI analyses. They support planning for the next year and are geared toward executives and department heads.
- Marketing reports look at the specific metrics that are valuable for marketing teams. They can analyze high-level items, like ROI and overall performance, while determining the details of individual campaign effectiveness. Examples of these reports and their functions include:
- Monthly marketing reports: These reports show an overview of marketing performance trends and track progress toward company goals, catering to a broad audience.
- Weekly campaign reports: These focus on short-term marketing activities, allowing marketing leaders and contributors to track the success of active campaigns.
- Ad-hoc reports: These custom reports are created as needed to address specific events, such as an unexpected drop in website traffic or a spike in campaign engagement.
- Financial reports provide insight into the critical metrics that keep your company afloat. These can be high-level overviews or detailed looks at specific department budgets. These will be highly customized to the data that is important for your company. Some examples of these reports and what they do include:
- Budget reports: These can track marketing spend, resource allocation, and ROI. They help identify cost-saving opportunities and ensure resources are used efficiently.
- Revenue performance reports: Used to analyze sales and revenue trends, offering insights into which products, services, or sales channels are driving business growth.
- Customer insights reporting looks at the data your team needs to get a full picture of how your business serves customers. You can look at breakdowns by product or see customer retention efforts. These reports can also break down which customers are most valuable or provide insight into contract renewals or the likelihood of customers buying your products again. Examples of these reports include:
- Segment reports: Break down data by audience demographics, geographies, or buyer personas to identify trends and opportunities for targeted strategies.
- Customer satisfaction reports: Provide insights into customer feedback and satisfaction metrics, helping teams understand and improve the customer experience.
- Operational reports are similar to other report types listed here. They can provide high-level executive summaries of critical business processes or give granular insight into specific areas of operations like inventory levels or supply chain management. Here are some examples of operations dashboards companies can deploy:
- Daily operations dashboards: Provide real-time tracking of key operational metrics, such as production schedules, inventory levels, or service delivery times.
- Efficiency and bottleneck reports: Highlight process inefficiencies or areas where operations can be optimized to improve overall productivity.
Types of analytics
The types of analytics your company can use depend on your goals and the complexity of your data. They also vary depending on the questions you’re trying to answer. These questions can range across business functions, but they most often have a forward-looking component:
- What factors influence customer purchasing decisions so we can tailor our offerings to meet their needs?
- Which marketing channels drive the most conversions, and how does that help us understand how to allocate our resources?
- What are our top-performing products or services, and what can we expect for future demand?
- Where are the bottlenecks in our processes so we can improve them to save time and costs?
Here are a few examples of analytics a company can use and their corresponding business applications:
- Descriptive analytics focuses on what has already happened in a business. It uses historical data to summarize trends, such as monthly sales figures, website traffic, or customer acquisition rates. While a lot of reporting can cover this information, descriptive analytics goes further by identifying patterns and using past performance to inform future strategies.
- A simple example of this is a retail company that uses descriptive analytics to report how its sales increased by 20% during the holiday season compared to the previous year. This helps the company inform future staffing, inventory levels, and sales forecasts.
- Diagnostic analytics dig deeper to answer why something happened. It involves analyzing relationships between data points and identifying correlations to uncover the root cause of why something happened.
- If a website experiences a sudden drop in traffic, diagnostic analytics could reveal how a recent algorithm update by a search engine affected the rankings.
- Predictive analytics uses statistical models and machine learning to forecast future outcomes based on current and historical data. It’s often used for demand forecasting, customer behavior prediction, or risk assessment.
- A subscription-based business could use predictive analytics to estimate customer churn and take proactive steps to retain high-value customers.
- Prescriptive analytics goes a step further, recommending actions to achieve specific outcomes. It combines predictive insights with decision-making algorithms to suggest the best course of action.
- A logistics company could use prescriptive analytics to optimize delivery routes, reduce fuel costs, and improve delivery times.
Differences between reporting and analytics
Examples of analytics
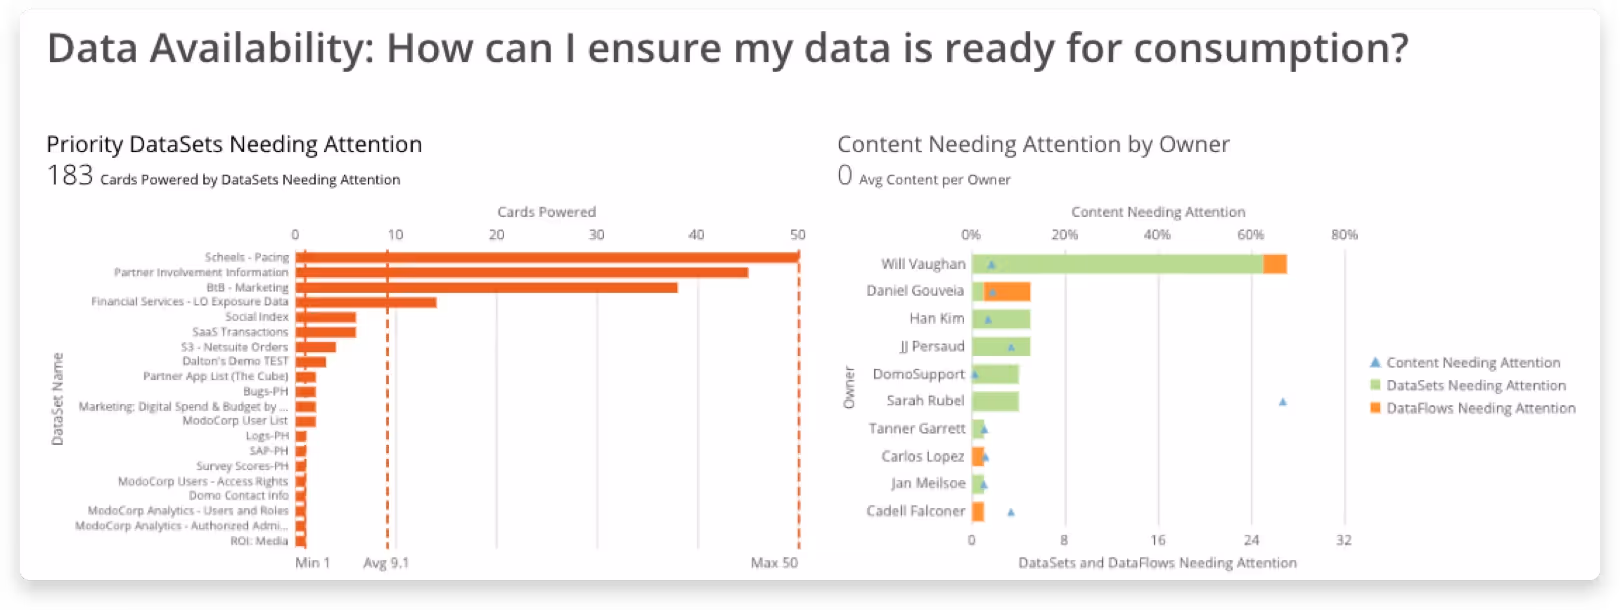
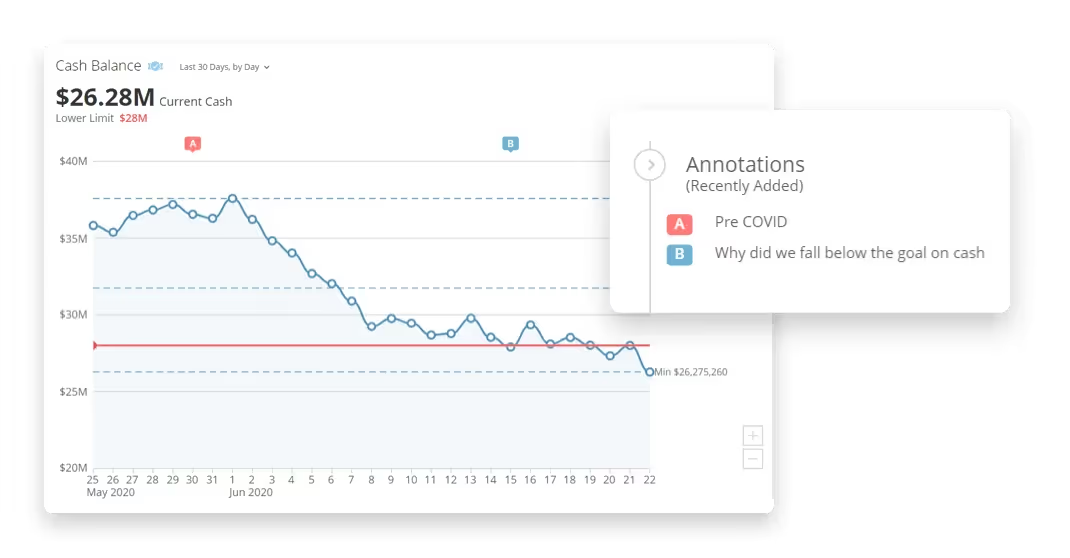
- Monitoring cash flow: Domo allows you to create a machine learning model to estimate the impact of areas of uncertainty, minimize forecasting errors, and run scenario analyses and simulations.
- Identifying factors driving customer churn using machine learning models to forecast retention.
- Predicting monthly revenue based on historical data and market trends.
- Employing machine learning algorithms to spot irregular financial transactions.
- Analyzing shipping data to minimize costs and delivery times.
Examples of reports
Data analysis summary. Use your data to look at your data.
Marketing campaign performance. See how a campaign is tracking your goals. You can also compare A and B testing.
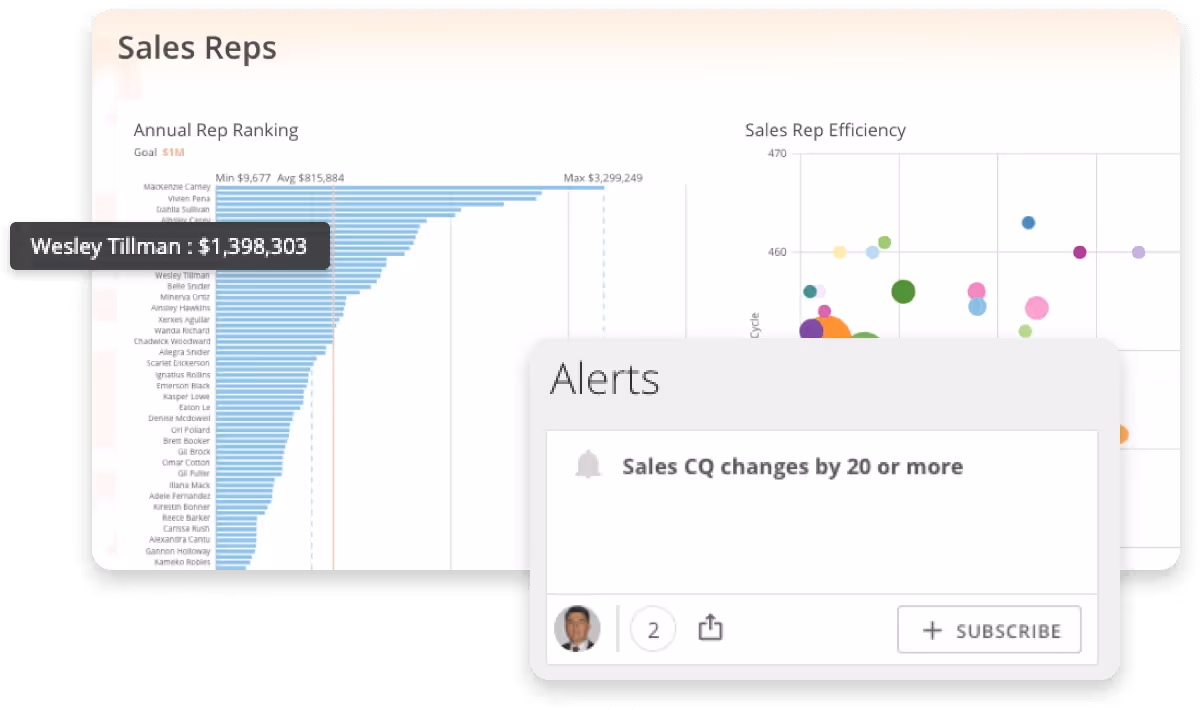
Sales reports. See how reps are performing.
Benefits of both reports and analytics
Reporting and analytics must work together. For analytics to provide prescriptive action based on your data, you first need reports to understand where you are now and identify the right questions to ask. Reports play an essential role in maintaining transparency and accountability, offering a clear view of key metrics and highlighting areas that require attention.
Analytics, on the other hand, go beyond summarizing data to uncover deeper insights that drive innovation and growth. By identifying opportunities for action, analytics provide businesses with the tools to stay ahead of the competition through proactive strategies. When used together, reports and analytics create a powerful framework for informed decision-making.
Best practices for effective reporting and analytics
Here are some best practices your company can implement:
- Establish clear objectives. Define the purpose of each report or analysis. What decisions will it inform?
- Choose the right key performance indicators (KPIs). Select metrics that align with organizational goals.
- Ensure data accuracy. Regularly clean and validate data to maintain its integrity.
- Foster collaboration. Involve both technical and non-technical stakeholders to maximize the impact of reports and analytics.
- Embrace continuous improvement. Use feedback loops to refine processes and adapt to changing needs.
The right tool for both analytics and reporting
It’s not difficult to see where reporting or analytics will fit into your daily workflows. It’s even less difficult to find a tool that will help support all of your data needs, whether you’re building out regularly refreshed report dashboards or digging deep into your data to see what is happening and why. Domo supports the entire data lifecycle, from gathering data directly from the source to creating customized data applications that seamlessly deliver data where you need it, you can use Domo for all of your data needs.
.png)

.png)