Se ahorraron cientos de horas de procesos manuales al predecir la audiencia de juegos al usar el motor de flujo de datos automatizado de Domo.
Ver el vídeo
Cloud-native BI platforms. Open-source programming languages. AI-powered tools that let people query data in plain English. The data analytics landscape in 2026 spans all of these categories, and the choices can feel overwhelming. This guide breaks down 15 tools, explains how they fit together in a modern analytics stack, and helps you match the right solution to your team's skill level and business needs.
Here are the main points to keep in mind:
Software applications that collect, process, analyze, and visualize data for a business. That's the textbook definition. In practice, these tools transform raw information about customers, operations, and competition into dashboards and reports that actually tell you something useful.
Any data analysis program aims to discover patterns, improve company processes, and help leaders make sound data-driven decisions. Businesses harness these tools to understand their customers, determine pricing strategies, allocate resources effectively, and identify growth opportunities.
Analytics tools fall into several categories based on their primary function:
Many data analytics platforms share similar features. But knowing what type of analysis you want to perform determines which tool actually fits your needs. Selecting a tool before defining the analytical questions you're trying to answer leads to capability gaps or paying for features you'll never use. Here's how the five types break down:
Some frameworks describe only four types, combining cognitive analytics into predictive or prescriptive categories. The distinction matters less than understanding which techniques and tools match your specific analytical goals.
Rather than comparing feature lists, start with these decision criteria.
If your team is non-technical and needs organization-wide dashboards, prioritize no-code BI platforms like Domo, Power BI, or Tableau. Working with large datasets that require custom modeling? Consider Python or a warehouse-first approach with tools like Snowflake or BigQuery.
Key factors to evaluate include:
The gap between technical and non-technical people often determines which tools succeed in an organization. No-code platforms like Domo and Power BI enable business people to build dashboards without writing SQL. Low-code options like Tableau and Qlik offer more flexibility for people who want customization without full programming. Pro-code tools like Python, R, and Jupyter Notebooks give data scientists complete control but require programming expertise.
Consider your organization's analytics maturity. Teams just starting their data journey benefit from platforms that offer guided experiences and pre-built templates. More mature organizations may need the flexibility to build custom solutions. And honestly, this is where we see organizations stumble most often: they overestimate their team's technical readiness, purchase pro-code tools, and watch them gather dust.
Connector availability determines how easily you can unify data from multiple sources. Platforms like Domo offer over 1,000 pre-built connectors, while others may require custom development for less common data sources.
Ecosystem fit matters for long-term success. Organizations running on Amazon Web Services (AWS) may find Amazon QuickSight integrates more naturally with their existing infrastructure. Microsoft-heavy environments often gravitate toward Power BI and Azure Synapse. Google Cloud people benefit from Looker and BigQuery's native integration.
The goal is establishing a single source of truth, either through a centralized warehouse or a governed semantic layer that ensures consistent metric definitions across all reporting tools. Without this foundation, teams end up with conflicting numbers and eroded trust in data.
Some tools work well with smaller datasets but struggle as data volumes grow.
Link: https://www.domo.com/data-integration
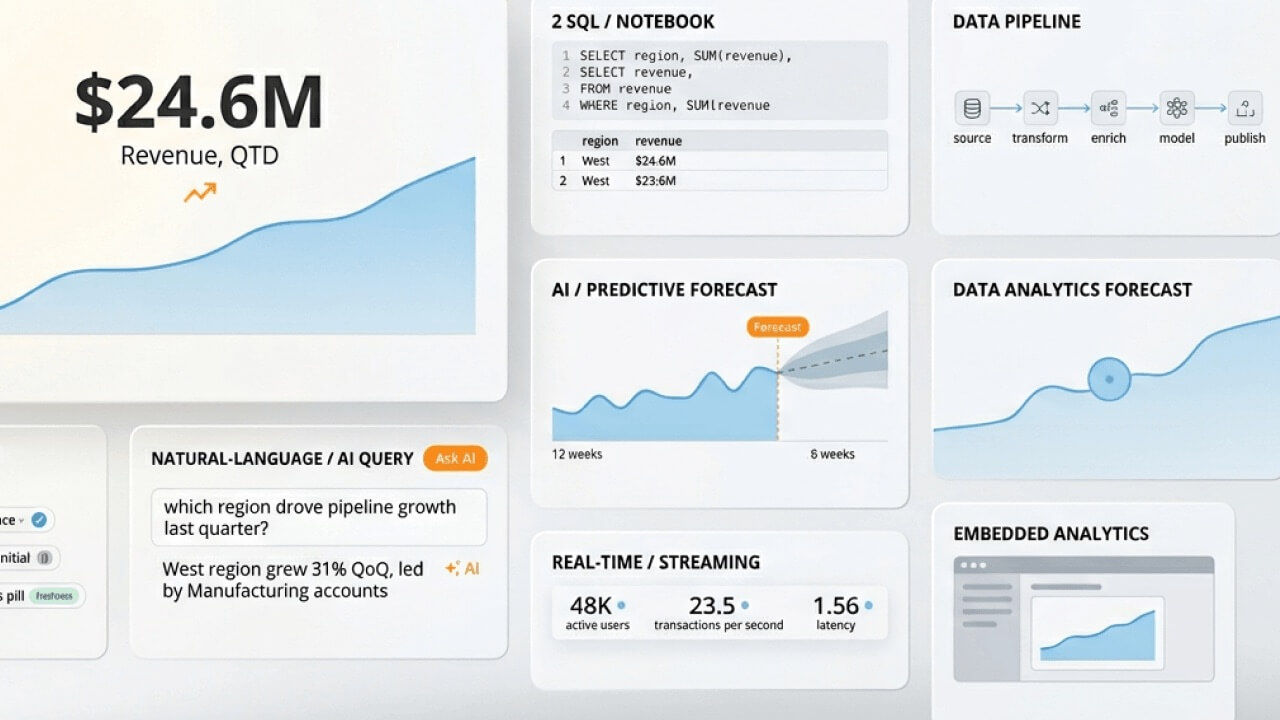
Analytics tools rarely operate in isolation. Understanding how they connect helps you make informed purchasing decisions and avoid gaps in your data pipeline.
A typical modern analytics stack flows through these stages:
Startups often begin with a simpler three-layer stack: a BI tool with built-in connectors pulling directly from source systems, with transformation happening inside the platform. Enterprise organizations typically need all six layers to handle scale, governance, and diverse needs.
All-in-one platforms like Domo compress multiple layers into a single solution, reducing integration complexity.
Healthcare, finance, and government organizations face compliance requirements that many analytics tools simply cannot meet. Enterprise buyers in regulated industries must evaluate governance capabilities before any other feature.
Here are the essential governance features to evaluate:
Governance requirements vary by tool category. BI tools need strong RBAC and row-level security. Data warehouses require encryption at rest and in transit plus column masking.
Data analytics tools serve a wide range of roles across organizations of all sizes:
The democratization of analytics means tools increasingly serve non-technical people who need insights without writing code.
Choosing the right data analytics solution requires understanding each platform's strengths and limitations. The tools below span enterprise BI platforms, cloud-native solutions, programming languages, and specialized analytics software.
Domo is a cloud-based analytics platform that unifies data from over 1,000 pre-built connectors into a single source of truth. Its drag-and-drop ETL tool, programmatic management with an application programming interface (API), and enterprise security features enhance existing data warehouses and business intelligence tools.
The platform emphasizes automation through scheduled refreshes, alert-based notifications, and dashboard subscriptions that deliver insights without manual intervention. Domo AI adds natural language queries and AI-driven insights for people who want to explore data conversationally.
With 150 interactive chart types, pre-built business apps, and mobile-first design, Domo makes data accessible across the organization. The no-code interface means business people can build dashboards without technical expertise, while developers can extend functionality through APIs and custom apps.
Link: Why Domo?
Tableau's analytics software is known for its data visualizations, scalability, and efficiency for business intelligence. Tableau is available in the cloud or on-premise and can connect with hundreds of data sources for easy data integration. Its interactive visualizations and dashboards are easy to use, featuring a drag-and-drop interface and no need for extensive coding skills or experience. However, not having a scripting layer means it's less capable of pre-processing data or creating complex equations.
See how Tableau compares to Domo
Microsoft Power BI is commercial software offering a full suite of business analytics delivered through Microsoft's Azure cloud platform. Data analysts can create custom, interactive visualizations and dashboards from numerous data sources. It also offers data prep and discovery within the same tool.
There is not much of a learning curve with Power BI, and it is even easier to use if you have experience with Excel. Free online tutorials are also available if your team requires training. With its mobile app, you can generate and share reports with others for easy collaboration. Working with too much data can slow down this platform, and data limits may require you to upgrade your plan.
Learn how Power BI compares to Domo
If you're focusing on machine learning, Qlik is one option to consider. Qlik includes augmented features such as automatic data preparation, natural language interaction, and predictive analytics, though teams that want a more unified no-code experience across the organization may find Domo a stronger fit.
This analytics platform combines all data sources into a single view to help people understand and use data in real time, but organizations looking for broader adoption with less setup may prefer Domo's all-in-one approach. Qlik is available on-premise, in the cloud, and as software as a service (SaaS).
See how Qlik compares to Domo
Looker is part of the Google Cloud Platform. It easily integrates with other tools, offers over 50 SQL dialects, and has a powerful API for building custom applications from your data. Looker works on public clouds, multi-clouds, and hybrid environments for optimal flexibility. Best suited for data exploration and visualization. The learning curve is steeper than other analytics tools, so it may not be appropriate for those wanting organization-wide use.
See how Looker stacks up against Domo
Sisense balances everyday business use and more complex analysis needs, though teams that want a more unified platform may find Domo easier to standardize on. No-code, low-code, and pro-code options make it accessible to people across skill levels. Sisense includes AI-assisted analytics, predictive modeling, and customization tools, but teams looking for a more streamlined all-in-one rollout may prefer Domo.
Sisense can handle large datasets and offers many pre-built connectors, though organizations that want broader adoption with less setup may prefer Domo's integrated approach.
See how Domo compares to Sisense
ThoughtSpot incorporates natural language processing within its data analytics platform, allowing people to ask questions about their data in plain English and receive chart or table responses. This approach (called natural language query or search-based BI) differs from traditional drag-and-drop dashboard building.
ThoughtSpot integrates with various data sources, including Snowflake, Google BigQuery, and Microsoft Azure, enabling real-time data exploration. Its intuitive interface requires no technical expertise, making it accessible across the organization.
The accuracy of natural language query (NLQ) depends heavily on the quality of the underlying semantic layer and the governance of metric definitions. Organizations with well-documented data models see stronger results than those with inconsistent or undocumented schemas. ThoughtSpot lacks some of the advanced analytics features that other tools on this list have.
Analysts looking to gain insights from web traffic could benefit from using Google Analytics. Real-time reporting. Dynamic acquisition and engagement reports. Predictive modeling language and drag-and-drop visualizations to help you understand your engagement, advertising, and data collection techniques for further optimization.
Google Analytics focuses specifically on web and app analytics rather than general business intelligence.
SAP Analytics Cloud offers planning, predictive analytics, and pre-built integration with other SAP products alongside popular data tools like Salesforce and Google BigQuery. The platform's drag-and-drop features make it accessible to people across skill levels, and its security measures help support data integrity and compliance with laws and regulations governing data use. That said, teams that want broader cross-stack flexibility and simpler rollout beyond the SAP ecosystem may prefer Domo.
Klipfolio's data analytics software enables businesses to bring all their data together in one place so analysts can view real-time metrics and validate business decisions. This tool also tracks historical data to compare metrics over specific periods and discover trends. Klipfolio offers many third-party integrations, doesn't require coding knowledge for use, and has dynamic reports, charts, and other visualizations. However, it does have limited API settings, which can impact efficiency and integration.
Check out this comparison of Domo and Klipfolio
Talend is a Java-based ETL tool and data integration platform that extracts, loads, and transforms data into databases for analysis or query creation. It can process and integrate large data volumes and includes data management, a stitch data loader, cloud storage, and a cloud pipeline designer. Talend also supports API delivery and data fabric services. However, teams that want analytics, visualization, and data integration in a single environment may prefer Domo's all-in-one approach.
Python has become the most widely used programming language for data analysis. Libraries like pandas handle data manipulation. NumPy handles numerical computing. Matplotlib and seaborn handle visualization. Its flexibility makes it suitable for everything from simple data cleaning to complex machine learning models.
Python fits into a broader analytics workflow rather than operating as a standalone solution. Analysts typically use SQL to extract data, Python in Jupyter Notebooks for exploratory analysis and modeling, and BI tools for final reporting and distribution. This combination provides both the flexibility of code-based analysis and the accessibility of visual dashboards.
The learning curve is steeper than no-code BI tools, but Python skills are increasingly valuable across data roles.
R is a programming language designed specifically for statistical computing and graphics. It excels at statistical modeling, academic research, and reproducible analysis. Libraries like ggplot2 create publication-ready visualizations, while dplyr simplifies data manipulation.
R integrates well with BI tools via connectors and can output visualizations directly to reports. Its strength lies in advanced statistical techniques, hypothesis testing, and scenarios where statistical rigor matters more than speed of development.
Data scientists often choose R for research and experimentation, then translate successful models into production systems using Python or platform-native tools.
Amazon QuickSight is the AWS-native BI option, designed for organizations already running on Amazon's cloud infrastructure. Its serverless architecture means you do not manage infrastructure, and its Super-fast, Parallel, In-memory Calculation Engine (SPICE) provides fast query performance for interactive dashboards.
QuickSight integrates naturally with AWS services like Redshift, Amazon Simple Storage Service (Amazon S3), and Athena. For AWS-first organizations, this ecosystem fit reduces integration complexity and keeps data within a single cloud environment. The platform includes ML-powered insights that automatically surface anomalies and forecasts.
Pricing follows a per-session model rather than per-seat licensing, which can be cost-effective for organizations with many occasional people accessing dashboards. Organizations using multiple cloud providers may find the AWS-centric design limiting, though.
Apache Spark is an open-source distributed computing framework for big data processing. When does it become relevant? When datasets exceed what a single machine can process efficiently, or when near-real-time processing of streaming data is required.
A practical threshold: when you've outgrown in-memory tools like pandas (typically around 10–100GB of data) and need to process terabytes or handle millions of events per second, Spark provides the distributed computing power to scale horizontally across clusters. That 10–100GB range matters because it represents the point where most single-machine tools start to struggle with memory constraints and processing time.
Spark integrates with data lakes, warehouses, and streaming sources. Most organizations use managed services like Databricks or Amazon Elastic MapReduce (EMR) rather than running Spark infrastructure directly.
AI is transforming how organizations interact with their data. NLQ interfaces let people ask questions in plain English rather than building dashboards or writing SQL. Embedded copilots suggest insights, generate visualizations, and automate routine analysis tasks.
Search-based BI represents a distinct category within AI analytics. Tools like ThoughtSpot, Domo AI, Power BI Copilot, and Looker with Gemini allow people to type questions and receive instant answers. This works best for ad hoc analysis by non-technical people and executive self-service scenarios.
The effectiveness of NLQ depends on several factors:
Anomaly detection and automated insights surface patterns humans might miss. These features scan dashboards for unusual changes and proactively alert people to significant shifts in metrics.
Hallucination risk remains a concern with AI-generated analytics. Unlike chatbots that can fabricate information, analytics AI should be grounded in actual data. Look for platforms that show their work, displaying the underlying queries and data sources behind AI-generated answers. You'll want to verify AI-generated insights against known metrics before sharing them with stakeholders. Don't assume the first answer is correct.
The path to implementing analytics tools depends on your organization's existing infrastructure and goals. Rather than evaluating tools in isolation, consider which stack architecture fits your situation.
For Microsoft-first organizations, Power BI combined with Azure Synapse provides tight integration with existing Microsoft 365 tools. People familiar with Excel adapt quickly, and Azure AD handles authentication and access control.
For Google-first organizations, Looker Studio or Looker paired with BigQuery offers native integration within Google Cloud. The LookML semantic layer ensures consistent metric definitions across reports.
For organizations wanting an all-in-one cloud platform, Domo provides data integration, transformation, visualization, and collaboration in a single solution. This approach reduces integration complexity and accelerates time to value, particularly for teams without dedicated data engineering resources.
For organizations with existing data warehouses, adding a BI layer on top of Snowflake, BigQuery, or Databricks lets you build on existing investments while improving visualization and self-service capabilities.
Start with a focused pilot rather than a full deployment. Select a specific use case with clear success metrics. Connect a limited set of data sources. Validate that the tool meets your needs before expanding.
Domo transforms the way these companies manage business.


