Se ahorraron cientos de horas de procesos manuales al predecir la audiencia de juegos al usar el motor de flujo de datos automatizado de Domo.
Ver el vídeo
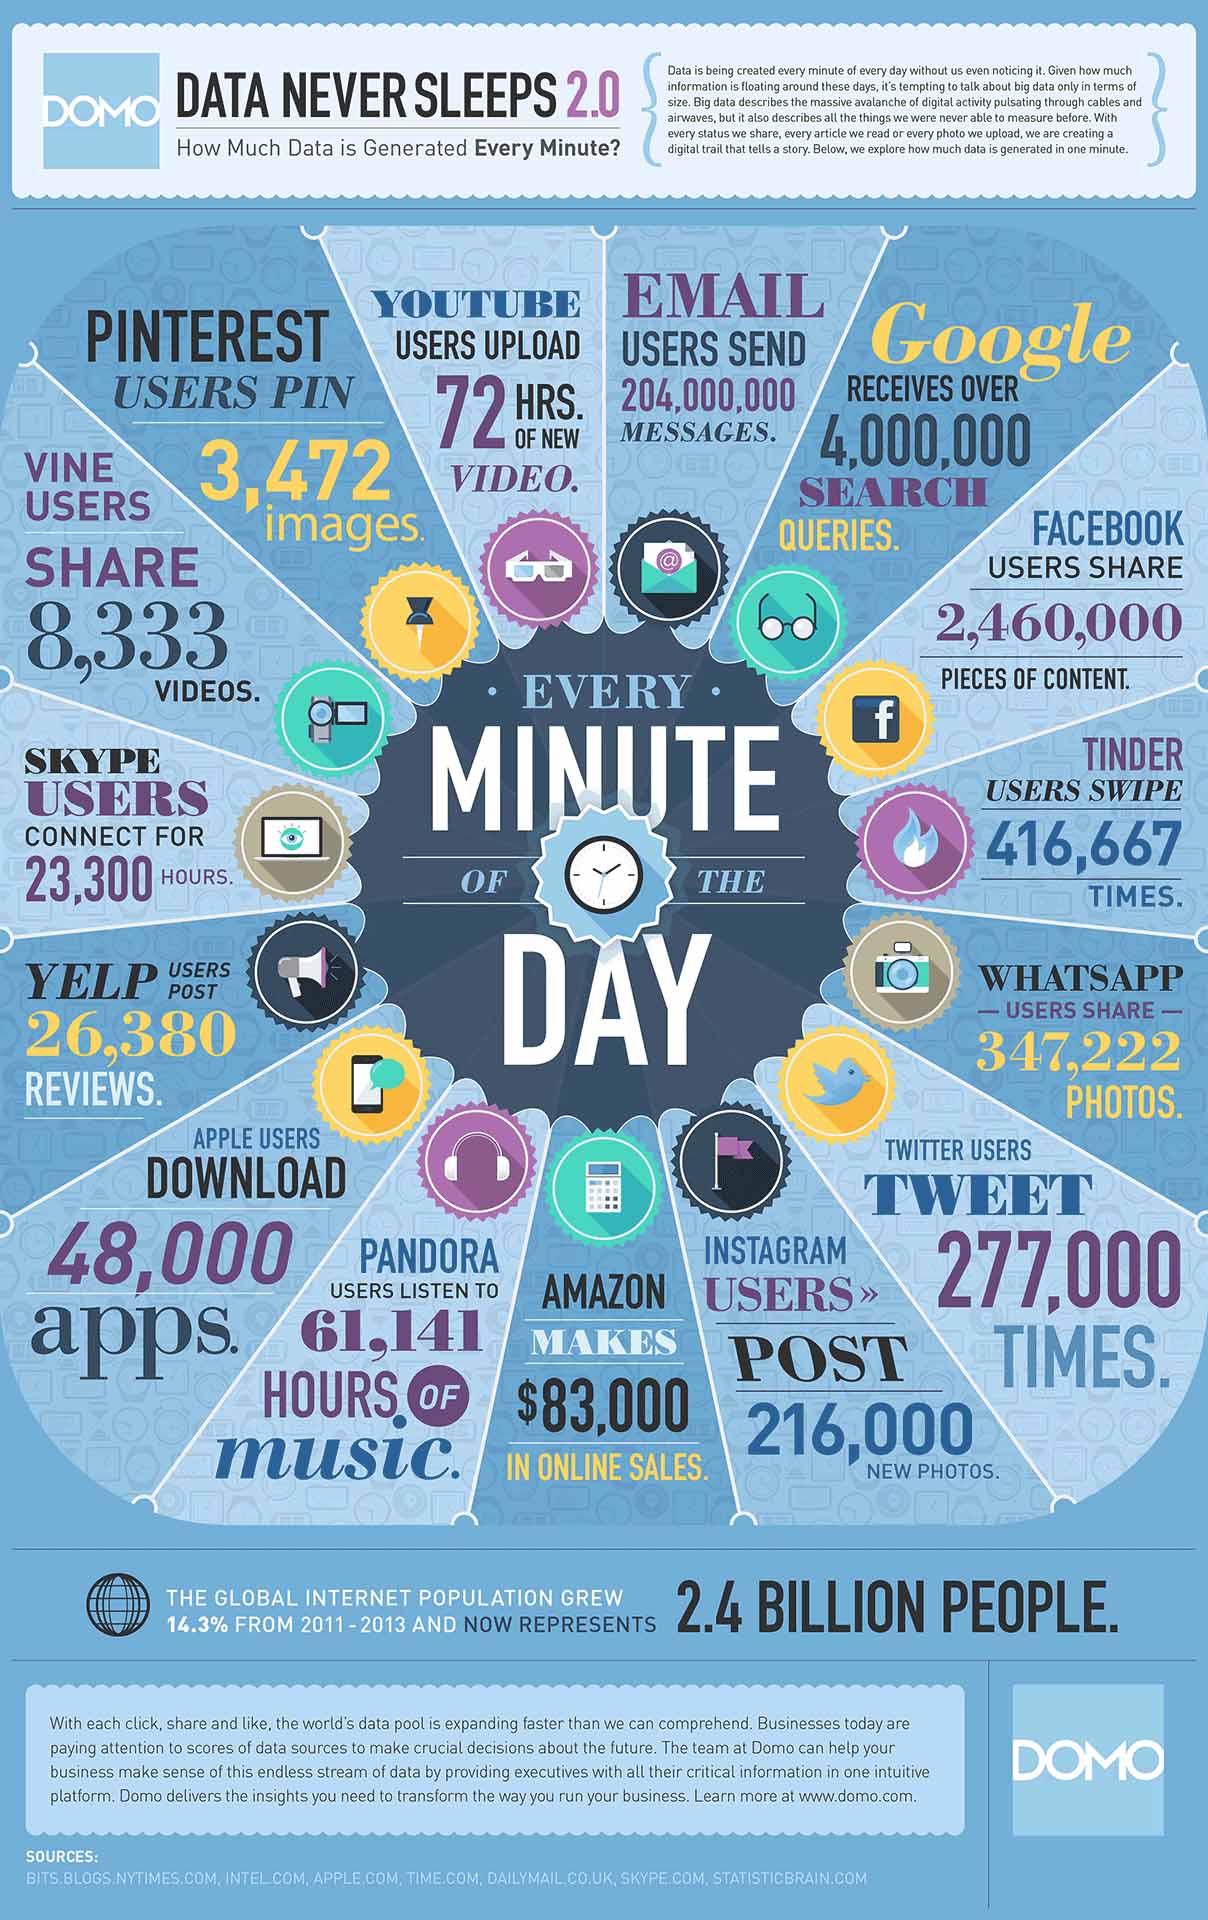
See the updated Data Never Sleeps 4.0 Infographic here!
Sixty seconds might seem like an insignificant amount of time, but when you look at it in terms of how much data is created, there’s a whole lot going on.
Almost two years ago, we created an infographic to highlight just how much digital data was generated every minute. The numbers were staggering.
Recently, we decided to revisit the topic and found—unsurprisingly—that the pace of data creation has continued to accelerate. Our first infographic, for example, showed that Facebook users shared 684,478 pieces of content per minute. Fast forward a couple of years and that number has exploded to 2,460,000 pieces. Insane.
There’s no doubt that the increase in the internet population has played a part in data’s tremendous growth. However, there’s something bigger at play: new technologies continue to emerge that allow people to create and share information in ways never before possible. These additional forms of sharing deliver a sense of connectedness, adding new value to people’s lives.
With all our data creation—clicks, likes, tweets, photos, blog posts, online transactions—our digital data tells a compelling story about who we are and what we do. For people and businesses alike, the key to making these digital actions worthwhile is ensuring they and the data they create continue to improve our lives.
I don’t anticipate the growth of data slowing down in my lifetime. There’s too much goodness to be mined from it all.
Check out what happens in a minute via our newest infographic:


.png)
