Join the AI + Data Tour for hands-on training, real customer stories, and time with Domo product experts near you.
Register now

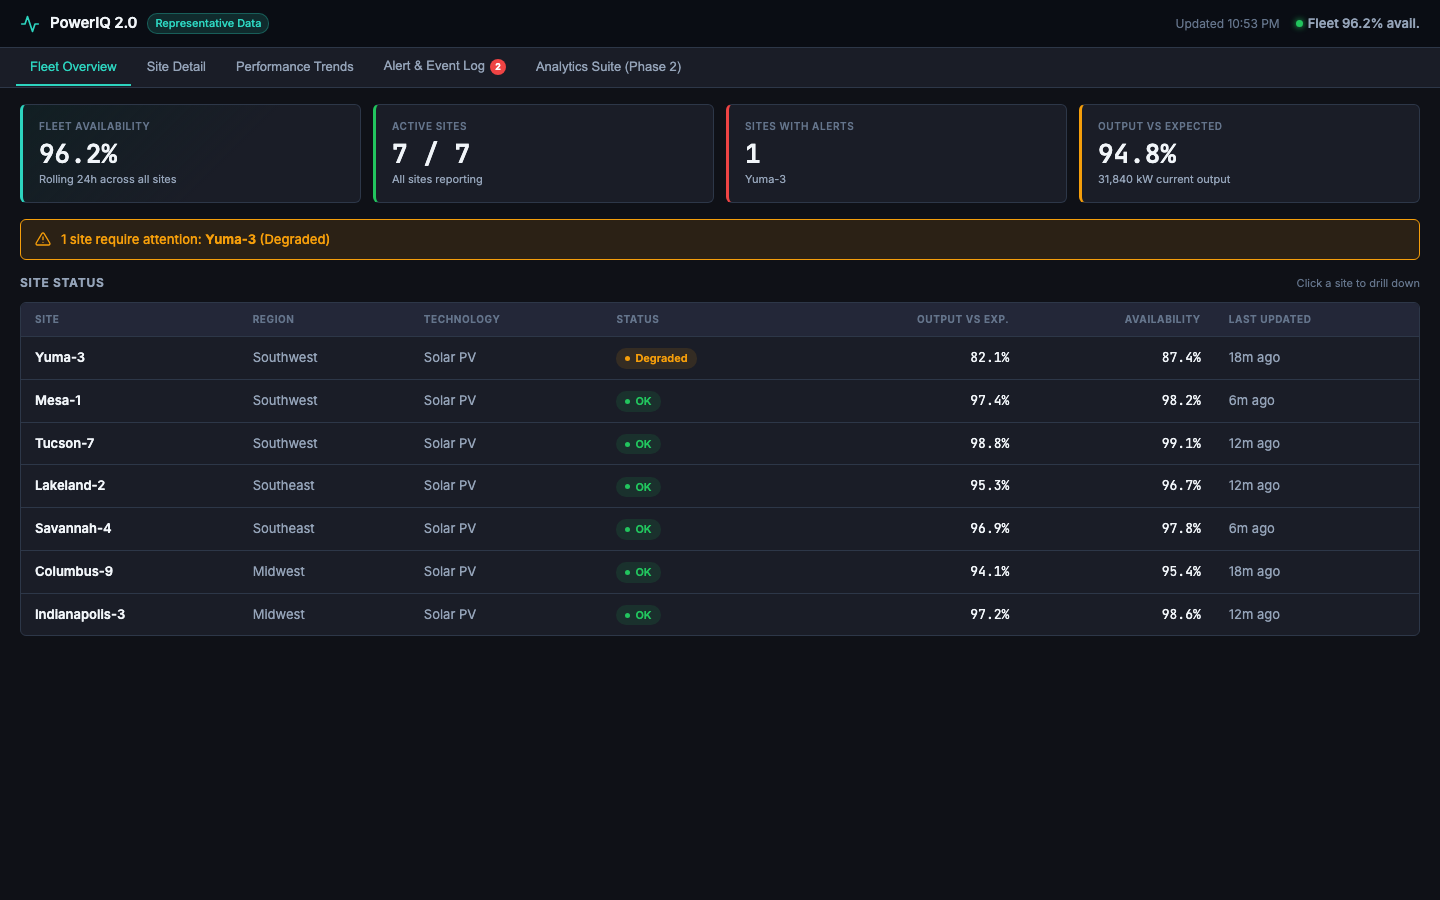
## The problemOperations teams managing distributed power assets open three or four tools every shift just to figure out whether the fleet is healthy. Different systems return different numbers for the same metric, so the first half of any incident is spent reconciling reports instead of diagnosing the cause.## What this app doesOne operational view covers the entire fleet — performance, availability, and anomaly flags surfaced as soon as a site deviates from expected behavior. Clicking a flagged site pre-filters the detail view to the relevant time window and signal set, so engineers reach minute-level data in two clicks. Metric definitions appear on hover, ending debates about which calculation is in play. Adding a new site auto-populates the rollup without rebuilding reporting logic.## Key takeaways- One source of truth instead of conflicting reports- Fleet to site to signal drill-down without exports- Anomalies surfaced before revenue impact- Self-service for operators, engineers, asset managers, and leadership## Who it's forRenewable and distributed-energy operators, O&M engineering teams, asset managers, and executives who need same-day fleet truth.


