
Replace Excel Demand Planning with a Multi-Location Dashboard
The problem
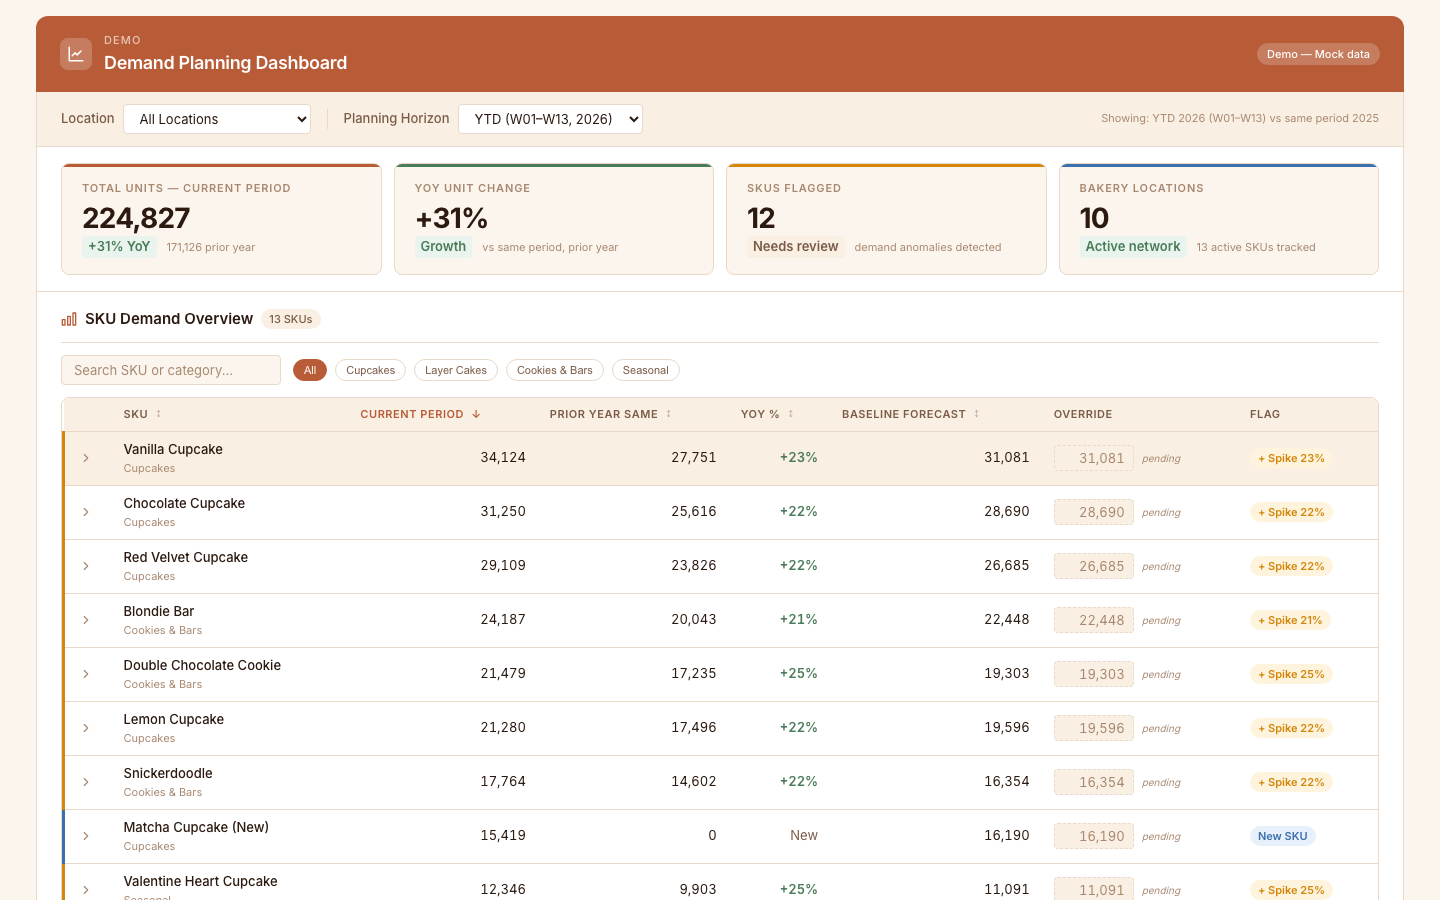
Supply-chain teams at growing multi-location retail brands forecast SKU demand inside Excel workbooks that demand a manual prior-year lookup for every line. As the location count grows, the workbook grows with it, and the planning cycle gets longer, more error-prone, and harder to audit each season.
What this app does
A demand-planning dashboard shows SKU history per location with prior-year same-period and trailing-period comparisons calculated automatically. A baseline forecast � the average of the last three same periods � appears alongside, ready for the planner to accept or override. Anomalies, defined as deviations beyond twenty percent from the trailing average, are flagged so the least-confident forecasts surface first. Filters cover location, SKU, and planning horizon. Submitted forecasts persist as an audit trail Excel cannot produce.
Key takeaways
- Prior-year lookup happens automatically
- Baseline forecast for every SKU as a starting point
- Anomaly flags surface the riskiest forecasts
- Planning history captured for audit and learning
Who it's for
Supply-chain planners, demand managers, and operations leaders at multi-location food retailers, restaurants, and bakeries.
Retire the Excel demand-planning workbook
See how Domo can replace manual SKU forecasting with a multi-location dashboard your planners will open every cycle. Custom build delivered in under two weeks.
{{custom-cta-1}}