
Paid Media Performance Charts Without the Excel Rebuild
The problem
Agency teams spend hours every reporting cycle rebuilding the same charts in Excel—exporting aggregated paid media data, pivoting it, formatting it, and pasting it into a client-facing deck. The charts never change much, just the timeframe and the product or promo. The work is repetitive, error-prone, and gets in the way of the actual analysis.
What this app does
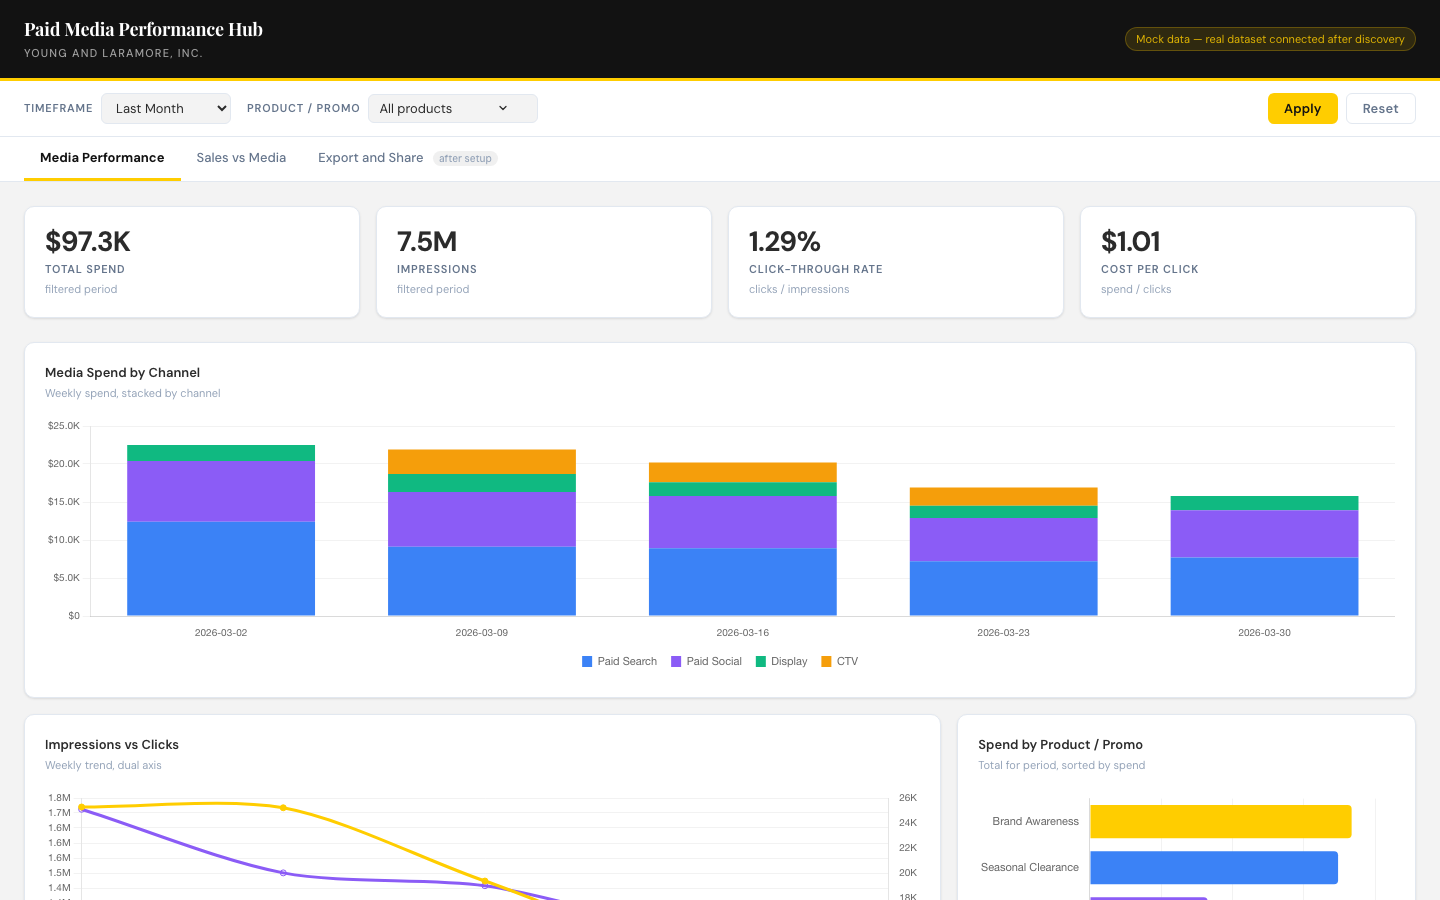
A paid media performance hub that produces those same charts inside the analytics platform—already filtered, already formatted, ready to share. The team opens the app to a default view of the most recent period across all products and promotions. Filter controls swap timeframe, product, and promo without leaving the page. Charts update interactively. The view exports or shares as a client-ready link, and the underlying data refreshes automatically as datasets update.
Key takeaways
- Same charts, generated inside the platform, no Excel rebuild
- Filter by timeframe, product, or promo without re-exporting
- Auto-refresh keeps the latest data ready when the team opens the app
- Client-shareable view in minutes instead of hours
Who it's for
Agency reporting teams, paid media analysts, and marketing operations leads who currently rebuild client charts in Excel each cycle.
Stop rebuilding the same client charts every week
See how Domo can deliver your recurring paid media charts as a filterable, client-ready view inside the platform. Request a tailored agency reporting build.
{{custom-cta-1}}