
OPEX Variance Analysis Without the Excel Labeling Step
The problem
Monthly OPEX reporting eats analyst time that should be spent explaining variances. Today the cycle is export GL, paste into Excel, hand-label every line with a vendor, calculate actuals vs budget vs prior year, then rebuild a PowerPoint deck. By the time the analysis lands, the meeting is half over.
What this app does
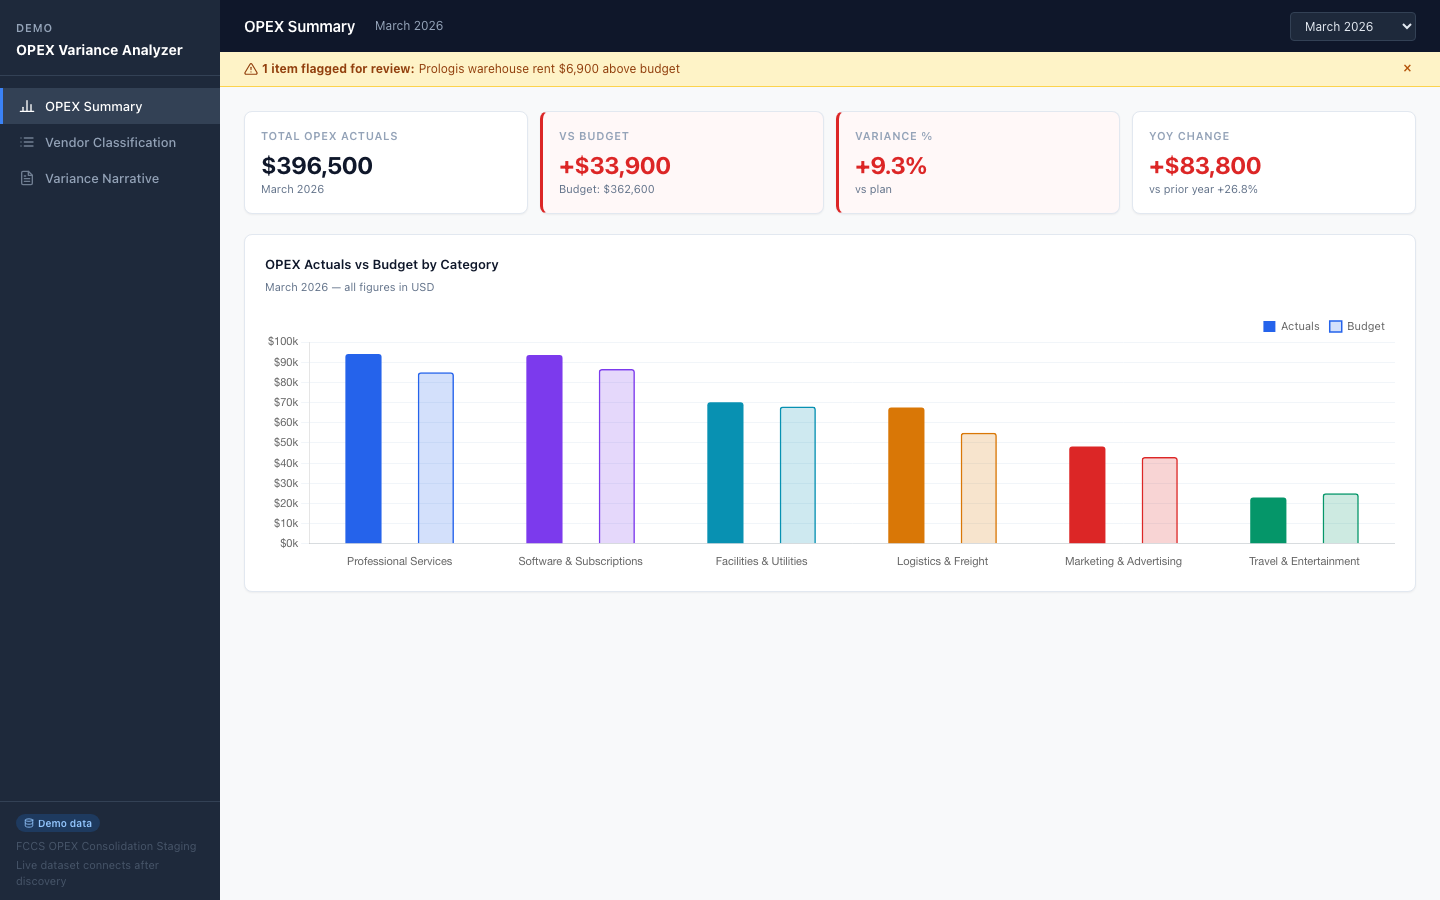
An OPEX workspace where the consolidation data lands pre-loaded, vendor names are auto-classified from GL descriptions, and variance against budget and prior year is always live. Outliers are flagged automatically. AI drafts a first pass of variance narrative bullets the analyst can edit and ship. Stakeholders get the view directly—no PowerPoint assembly.
Key takeaways
- Vendor auto-classification kills the #1 manual step
- Actuals vs budget vs prior year variance, always current
- Anomaly flagging surfaces outliers without manual scanning
- AI-drafted commentary turns analysts into editors, not assemblers
Who it's for
Financial planning and analysis teams at manufacturing and operations-heavy companies who own monthly OPEX reporting and need their cycle to be analysis time, not assembly time.
Stop assembling the OPEX deck from scratch
See how Domo can turn your monthly close into a live variance workspace with AI-drafted commentary your stakeholders read directly. Request a tailored build for your GL and budget structure.
{{custom-cta-1}}