
Side-by-Side Commission Plan Modeling for Brokerage Leaders
The problem
When a brokerage owner or VP wants to test a new commission plan, the answer lives in a complicated Excel file that nobody trusts and most people abandon. Branch managers cannot model a quick scenario before a leadership meeting. The decision ends up driven by gut feel because the math is too painful to redo.
What this app does
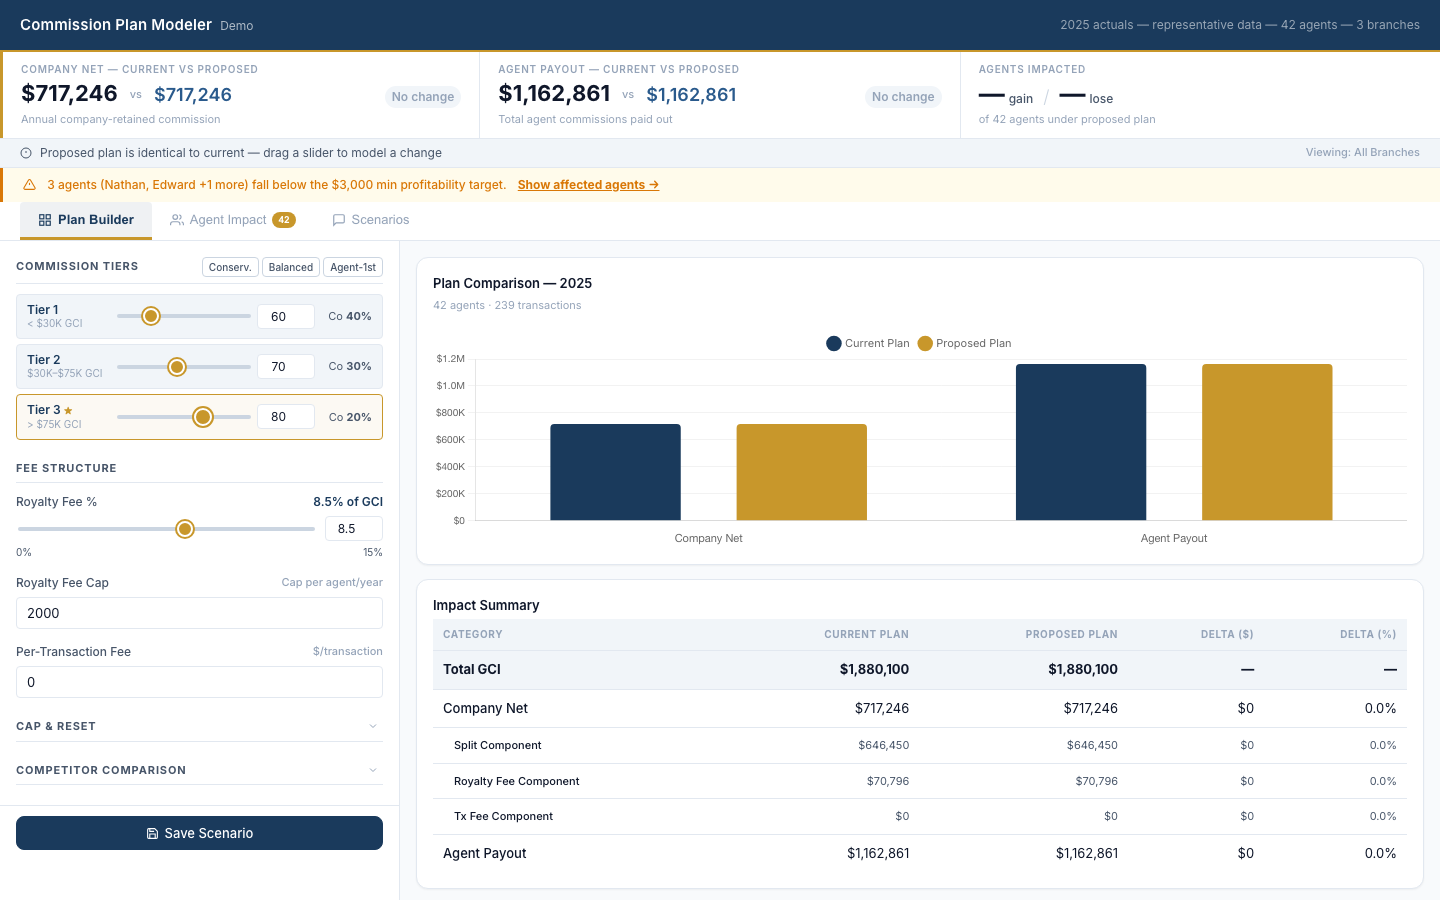
A live commission scenario workspace pre-populated with real transaction data. Leaders adjust plan variables—split percentages, tier thresholds, caps, bonuses—and the entire model recalculates instantly across a full year of actual unit and volume data. A side-by-side comparison shows the current plan against the proposed plan: net company dollars, total agent payout, and per-agent winners and losers. Scenarios can be saved, filtered by branch or agent tier, and screenshotted into a leadership conversation.
Key takeaways
- Instant recalculation against a full year of real data
- Side-by-side comparison of current vs. proposed plan
- Per-agent impact view shows who gains and who loses
- Filter by branch, tier, or date range without rebuilding
Who it's for
Brokerage owners, VPs, controllers, and branch managers who need to evaluate compensation changes before committing.
Replace abandoned Excel models with a live calculator
See how Domo can turn commission planning into a two-minute scenario test instead of a multi-hour spreadsheet exercise. Request a tailored brokerage build.
{{custom-cta-1}}