Ressources
Retour

Vous avez économisé des centaines d'heures de processus manuels lors de la prévision de l'audience d'un jeu à l'aide du moteur de flux de données automatisé de Domo.

Regardez la vidéo
À propos
Retour
Récompenses
Reconnu comme un leader pour
29 trimestres consécutifs
Leader du printemps 2025 en matière de BI intégrée, de plateformes d'analyse, de veille économique et d'outils ELT
Tarifs

Give your charts more visual appeal.

July 2020

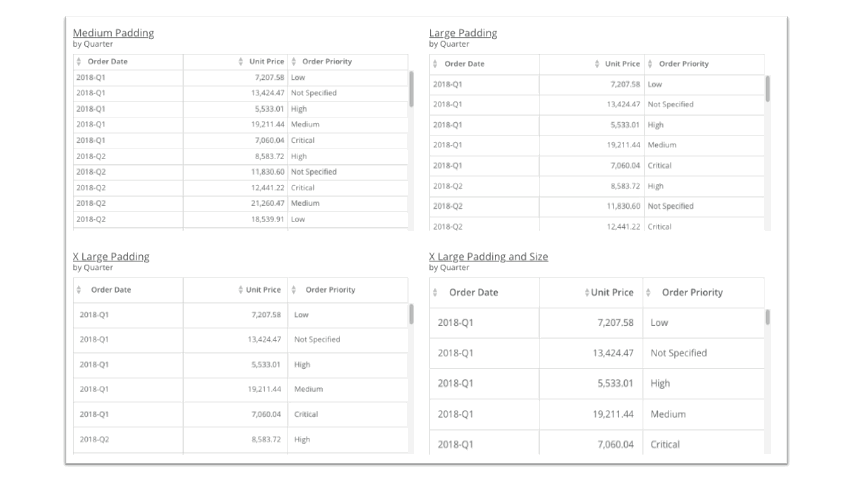
Your Stories will look even cleaner and have more impact with these updates:

  • Table charts. You can now add custom padding to your table cells.
  • Single-value charts. Find additional bold font options for more impact.
  • Lat/Long Map charts. Emphasize larger numbers with larger visual bubbles.
  • Mega Tables. Use dynamic row paging to reduce lag in loading time, and override row display limits while still maintaining responsiveness. You can also now use copy/paste commands in Mega Tables.
  • Map charts. Find new border options and max/min value scales.
  • Radial gauge charts. Get more flexibility by setting the gauge width, major and minor ticks, degrees of display, needle look, and more.

For all charts, you can also now create a customized message to replace “No data for filtered range” when a chart doesn’t contain any data.

Table of contents
Try Domo for yourself.
Try free

Related Resources

Explore all

Domo transforms the way these companies manage business.