A place for AI forward engineers and leaders
Watch sessions on building AI agents grounded in your governed data.
Watch now

Pleasure to be here. So thank you for that introduction. I am Curtis Villal. I am the global Product Manager for Ultimate Medical. At Ultimate Medical, we are a complex rehab technology manufacturer. We provide equipment to the CRT industry that includes standing devices, adaptive mobility, positioning equipment and diagnostic tables. So we have a huge product portfolio that spans over six brands. So what that means is when you have that many brands and you're the product manager, I was dealing with a lot of spreadsheets. So my presentation is going to be more so the journey and then AI being the hero at the end. But starting out, we had just as I'm sure many of you had, was massive amounts of spreadsheet data, spreadsheet after spreadsheet. We did inherit NetSuite, which is our ERP and we became Domo users about two years ago. So it was a huge lift for Domo to be our business intelligence with helping this group dashboards. We later moved to apps, but let me transition this slide because I only have ten minutes and I get super excited for some of the things that AI has done for me through Domo.
So basically I was dealing with data mining and it was just the manual grind of everything. The spreadsheets were just becoming a sea of just confusion. They provided great data with one view, but often I would get in a meeting and someone would just want one more view of a data set that was not captured in that particular pivot table. So, you know, of course the response was, yeah, no problem, I can do that. But inside I was like, Oh my goodness, that took me three hours just to get this. So, you know, one of the things that I learned, like the slide that is up here just shows a lot of confusion, a lot of things going on at one time because that is where I was. So, you know, I was doing all these spreadsheets and I would get buried in just a repetitive task, right? So data mining, data mining not really getting good results. No one had a clear vision when we left these meetings. All they had were like fragmented visions through multiple spreadsheets. That left not only me frustrated because I was the one digging through all the data, but it really left the person frustrated that had one question that they wanted answered because they were not able to get a clear picture. So a lot of time was lost with being inefficient.
So with that comes what we really had to do to really pull back the layers to see like, what are these spreadsheets really telling us, right? So, you know, as you can see in the illustration, the more tasks that you add onto a pivot table, the harder it is to identify exactly what you're trying to see when you're trying to do this to, you know, fifty people that are in the room that may have fifty different questions, right? So the more tasks you get, the smaller the information becomes, the less valuable it becomes.
So now this is the beautiful part. I visited Domopalooza for the first time this year. I got super hyped. I was up in my hotel probably I think like two nights. I may have gotten two or three hours of sleep. But the one thing that sparked me was they introduced me to Procode, which was amazing that I could actually build an app because I'm a non-technical person, I do not know code. So Procode really helped me create this huge like endless like knowledge base of all the things that were on my wish list. And now I could really do it right. So I won't go through the time of going through all the little manual things that are on this spreadsheet everybody can read on there. So I'm just going to go straight into the app. I just want to share my screen to make the best use of this time to show you pretty much what the end result was.
So I did want to share one quote though. Data turns sales from guesswork into a repetitive growth engine. I quoted that. I even checked with Claude to make sure nobody else has quoted that. So I can actually coin this phrase. So because that is what we were doing, we were turning guesswork into a repeatable growth engine because now the data is being displayed in a uniform fashion that we can actually see trends, we can see forecasting, we can see the loopholes, we can see the gaps that we could not see through all of these spreadsheets. So what this did, it turned me into a super product manager with an AI assistant. So I'm going to stop sharing my presentation so we can get directly into the app. OK, there we go.
So now this is the actual app and I'm going to take you through a little journey with the app. So the first day of Domopalooza, I went back to the hotel room and I'm hoping everyone can see my screen, but I went back to the hotel room. I built this app the first night I had no clue what I was doing. I was just following pro code and it really helped me out. And the next day, I spent probably three hours in the brilliance bar with them helping me kind of go through some tweaks.
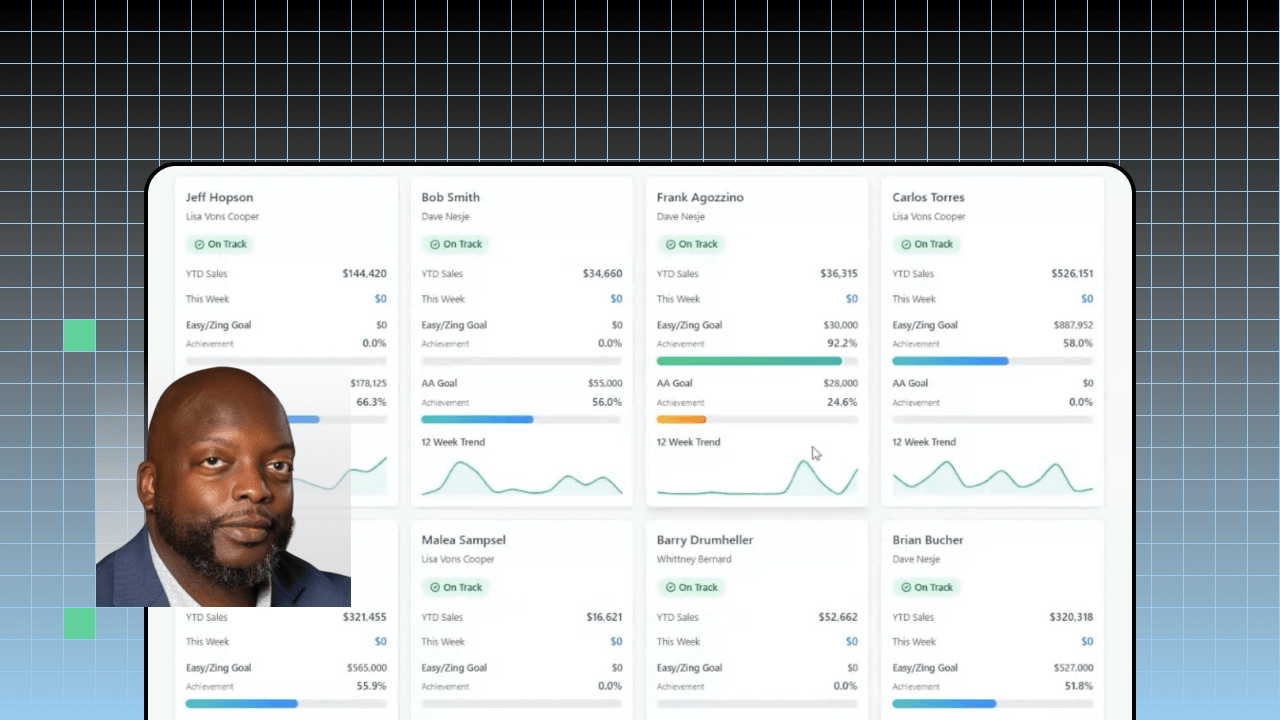
So what this shows is this gives a clear picture of we have fifty plus sales reps in the field. It shows what their goals are for the year. It shows their progress to the goal. It also has a quarterly trend, which is a like a twelve twelve week trend. It shows if they're on track or off track for obtaining that goal for the year. But the cool part is we didn't stop there. That was just one piece of the puzzle. The second piece was, hey, that's great. We don't have really good insights to tell us, like where do we focus?
So what we've done now, I was able to through an ETL I was able to get a report to go to the sales managers that broke this down and filtered it by the top three lagging accounts. It gives a top overview of whether the sales reps are growing, if they're flat or if they're behind, just basically their pace and it shows where they should be for the year. So the thing that this does, it gives them three accounts to focus on and it gives them the actual product to focus on, but does not stop there. That still did not give us the insights that we were looking for.
So we went once again to AI and this is what we did. We created an insight of the same data. Now I can actually see the insight. The column on the left is where basically the contributing factors as to why the account is at the place it is today currently and suggested activities is on the right, things that we can do to get this account to the satisfactory growth level.
So feeding this in the background with the knowledge base is not only our inventory data, our sales quote data, there's population data or population trend data for all the zip codes that we sell into. There is reimbursement data, we have our trade show or education, even the demos that we have in the field. All of these factors are contributing to the impact level on this account performance. So we're able to give our sales team insights into the performance. We're able to have them leave the room with tools that they could use to actually make an impact on that account as well as forecasting for them. So this is probably ninety percent complete because as you know, the more we grow, the more knowledge base grows and the more we can provide our sales team. So hopefully the next time I can show you an even more updated insight.
Managing a six-brand product portfolio across 50+ field reps with nothing but spreadsheets is a governance problem. Altimate Medical Global Product Manager Curtis Philyaw, a self-described non-technical builder, used Domo Procode and AI to replace that entire system with a single governed app that surfaces rep goals, 12-week performance trends, top lagging accounts, contributing factors, and AI-generated suggested activities, all fed by a knowledge base spanning inventory, reimbursement, population, and field demo data.
Domo transforms the way these companies manage business.