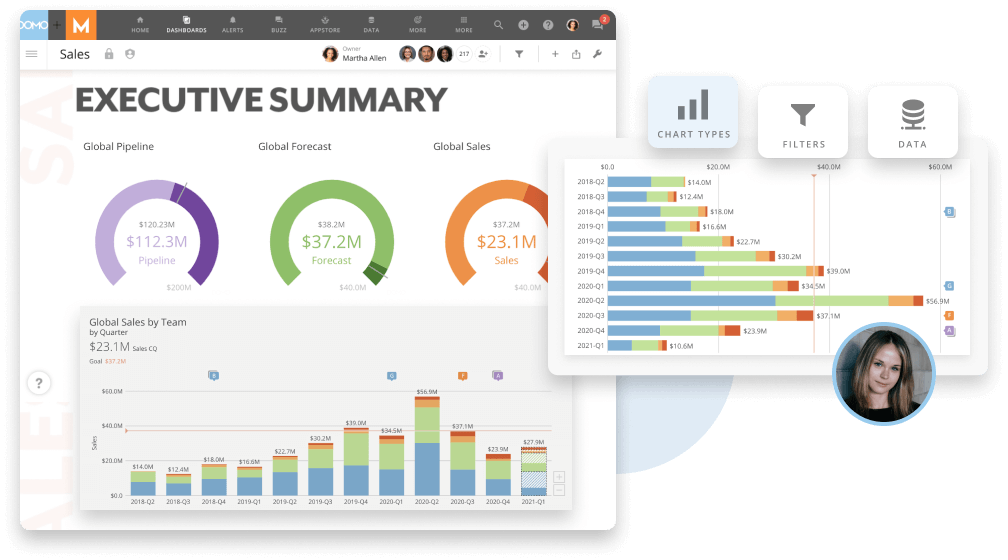
Vous avez économisé des centaines d'heures de processus manuels lors de la prévision de l'audience d'un jeu à l'aide du moteur de flux de données automatisé de Domo.
Regardez la vidéo

A well-designed BI architecture connects data sources, integration pipelines, storage layers, semantic models, analytics tools, and governance into a cohesive system that delivers trusted insights to decision-makers. This guide walks you through each of these core components, compares centralized, decentralized, cloud-based, and real-time architecture types, and provides practical implementation strategies. Whether you're building from scratch or evaluating your current setup, you'll learn what separates good BI architecture from great.
Here are the main points to keep in mind:
Business intelligence architecture is the foundational structure that governs how data moves through an organization. From its origin in source systems through ingestion, storage, transformation, semantic modeling, and finally to the dashboards and reports that inform decisions. Think of it as the blueprint connecting every piece of your data ecosystem, ensuring information flows reliably and consistently to the people who need it.
What separates a functional BI architecture from a fragmented one? Governance. How well it's embedded at every stage. Rather than treating security, quality, and access controls as an afterthought, a well-designed architecture weaves these considerations into each layer. Data gets validated at ingestion. Access restrictions tighten as it moves from raw storage to curated business-ready tables. Lineage tracking ensures you can trace any metric back to its source.
The industry commonly references a 5-layer model for BI architecture: data sources, data integration, data storage, semantic/processing layer, and presentation layer. Some frameworks expand this to 6 layers by separating the semantic and analytics layers or treating governance as a standalone component. Both approaches work. The key is ensuring each layer has clear ownership, defined standards, and appropriate controls.
A widely recognized pattern for organizing data across storage tiers is Medallion-style zoning, which structures data into Bronze (raw, landed data), Silver (cleaned and conformed), and Gold (curated, business-ready) layers. This approach provides a clear path from raw inputs to trusted outputs while making it easier to apply progressively stricter governance as data matures.
BI architecture touches nearly every corner of an organization. Different stakeholders engage with it in distinct ways.
Business intelligence architects design and oversee the systems that make data accessible and actionable. They're focused on building infrastructure that won't require constant rework as the organization scales, balancing technical requirements with business needs. Their core deliverables typically include reference architecture design, data modeling standards, toolchain selection, governance model documentation, and performance/cost targets.
Architectural engineers (especially in mid-market to large enterprises) often zoom out even further. They think about how BI architecture holds up across hybrid environments that mix legacy, on-premises systems with modern cloud platforms. And how to keep performance and flexibility from fighting each other.
IT leaders and data engineers care about governance, compliance, and pipeline reliability across the full technology stack. They need architectures that can handle growing data volumes without introducing bottlenecks or security gaps.
BI managers face a unique challenge: supporting both technical analysts who want granular control and business people who need simple, self-service access, all within the same architecture. They also tend to inherit tool sprawl, which makes governance and reliability feel like a never-ending game of whack-a-mole. (And honestly, that's the part most guides skip over.)
Data analysts are the day-to-day people who transform raw data into insights. They need reliable access to clean, well-organized data without having to navigate a maze of disconnected systems.
Analytics leaders at the director and VP level are accountable for turning BI into a strategic business driver, not just a reporting function. For them, architecture decisions directly impact whether the analytics team is seen as a cost center or a competitive advantage.
A well-designed BI architecture consists of six interconnected layers, each serving a specific purpose in transforming raw data into actionable insights. Understanding these components helps you evaluate your current setup and identify gaps that may be limiting your analytics capabilities.
This 6-layer model aligns with the industry-standard 5-layer framework, with some organizations combining the semantic and analytics layers into a single processing/presentation tier. The key is ensuring each layer has clear responsibilities and handoffs.
To see how these layers work together, consider a Monthly Recurring Revenue (MRR) dashboard. Customer subscription data originates in your customer relationship management (CRM) system (data sources), flows through an extract, transform, load (ETL) pipeline that standardizes date formats and currency (data integration), lands in your warehouse's Silver layer (data storage), gets defined as a certified metric with a specific calculation formula (semantic layer), powers a finance dashboard with trend visualizations (analytics layer), and is protected by role-based access so only finance and leadership can view customer-level details (governance). Each layer adds value while maintaining traceability from the final number back to its source.
Every BI architecture starts with data sources. The raw inputs that feed your analytics ecosystem. These typically fall into several categories:
The diversity of your data sources directly impacts the complexity of your architecture. Organizations with dozens of disconnected systems face different challenges than those with a more consolidated technology stack. Treating all data sources equally during initial architecture design? That's where teams stumble. Some sources require more validation, more frequent refreshes, or stricter access controls than others.
Data integration extracts data from various sources, transforms it into a usable format, and loads it into your storage systems.This is commonly known as ETL (Extract, Transform, Load).
The ETL process standardizes and cleans data from different sources, making it ready for analysis. Customer data from your CRM might use different field names than your e-commerce platform. ETL processes reconcile these differences so analysts can work with consistent data.
Modern architectures increasingly use ELT (Extract, Load, Transform), which loads raw data first and transforms it within the data warehouse. This approach offers more flexibility for complex transformations and takes advantage of the processing power available in cloud-based storage systems.
At scale, the goal is simple: pipelines that do not need constant babysitting. Automated ingestion, monitoring, and reusable workflow components can make the difference between a BI architecture that people trust and one that triggers late-night "why is this dashboard blank?" messages.
Effective data integration often determines whether your BI architecture delivers reliable insights or constantly produces conflicting reports.
The storage layer is where your processed data lives, ready for analysis. Three primary options shape this space.
Data warehouses are databases designed specifically for storing and analyzing structured data. A data warehouse organizes data in a way that makes it easy to query and report on, making it ideal for business intelligence workloads. Data warehouses work best when you have well-defined reporting needs and structured data.
Data lakes are repositories that can store data in its raw, unstructured form. A data lake is often used when you need to store large volumes of data that is not yet ready for analysis or when you're working with diverse data types like images, logs, or sensor data.
Data lakehouses combine the flexibility of a data lake with the query performance of a warehouse. This pattern has gained traction because it lets organizations store raw, unstructured data while still supporting fast structured query language (SQL) queries on curated tables, eliminating the need to maintain entirely separate systems.
Many organizations structure their storage using Medallion-style zoning:
Access restrictions typically tighten as data moves from Bronze to Gold. Analysts might have broad access to Silver-layer tables for exploration, while Gold-layer data powering executive dashboards may be restricted to specific roles.
The semantic layer sits between your raw data and the people who need it, translating technical database structures into business-friendly terms. Think of it as a translation layer that lets a marketing manager ask about "customer acquisition cost" without needing to know which tables and joins produce that metric.
This layer defines business definitions (what does "active customer" mean?), calculated metrics (how are key performance indicators, or KPIs, computed?), and relationships (how do different data elements connect?).
Beyond translation, the semantic layer prevents one of the most common problems in analytics: metric inconsistency across tools. When different teams calculate the same KPI differently, trust in data erodes. The semantic layer solves this by defining business metrics once, certifying them, and making them reusable rather than recalculated independently in each dashboard.
Consider how this works in practice. Revenue might be defined as the sum of order values where status equals "closed," excluding refunds processed within 30 days. Gross Margin might be calculated as revenue minus cost of goods sold, divided by revenue. Churn Rate might be customers lost divided by customers at period start, multiplied by 100. When these definitions live in the semantic layer, every dashboard uses the same formula.
The metric lifecycle typically follows a clear path: define the business logic, review with stakeholders, implement in the semantic layer, test against sample data, certify as trusted, and monitor for accuracy and usage. This workflow prevents the anti-pattern where spreadsheet KPIs proliferate without version control, lineage, or governance. Skipping the stakeholder review step leads to metrics that are technically correct but don't match how the business thinks about the concept. Confusion downstream is inevitable.
A well-designed semantic layer enables self-service BI by allowing business people to explore data without requiring SQL expertise or constant support from the data team. It also helps IT leaders keep governance from turning into gridlock. When standardized metrics live in the semantic layer, teams can move quickly without reinventing definitions in every dashboard.
Analytics turns data into insights. By using data analytics, businesses gain a clearer understanding of their customers, their operations, and the trends shaping their industry.
There are several types of data analytics, each answering different questions:
Modern BI architectures increasingly incorporate AI-powered analytics that can automatically surface insights, detect anomalies, and suggest next steps. Analytics leaders who want to position their function as a strategic driver rather than a reactive reporting servicenow consider these capabilitiesessential.
Another shift: teams want to operationalize insights, not just present them. That often means pairing analytics with automated workflows so the architecture can route alerts, trigger actions, or notify the right team when the data changes.
The reporting layer delivers insights through dashboards, visualizations, and interactive tools that allow people at all levels to explore data and make informed decisions.
Data governance is the framework that ensures your data is accurate, secure, and used appropriately. When BI tools are fragmented across an organization, enforcing consistent governance becomes nearly impossible, creating compliance exposure and eroding trust in the data.
A well-designed governance layer maps security controls to specific architecture layers rather than treating governance as a single blanket concept:
Additional governance components include data lineage (where did this data come from and how was it transformed?) and quality standards (what rules ensure data accuracy through automated validation?).
For enterprise organizations, governance is not a checkbox. It's the foundation that makes self-service analytics trustworthy at scale. IT and data leaders often look for a centralized management layer so security, compliance, and governance apply across data workflows and personas, not just one tool or one team.
There's no one-size-fits-all approach to BI architecture. The right choice depends on your organization's size, culture, technical maturity, and specific needs.
The following comparison summarizes key architecture types and when each fits best:
When choosing an architecture type, consider these decision criteria:
Centralized BI places control with IT or a dedicated data team. All reports, dashboards, and data access flow through a single group that maintains standards and ensures consistency.
Pros: Consistent definitions, strong governance, single source of truth Cons: Can create bottlenecks, slower response to business requests, less flexibility
Decentralized (self-service) BI empowers business people to create their own reports and analyses without relying on IT for every request.
Pros: Quick insights, greater business agility, reduced IT backlog Cons: Risk of inconsistent metrics, potential data quality issues, governance challenges
Most organizations land somewhere in between. The tension is enabling business-team autonomy while maintaining architectural control. There's no clean answer. Your approach should reflect your organization's governance maturity and the technical sophistication of your people.
Cloud-based BI runs on infrastructure managed by a cloud provider, offering scalability, reduced maintenance burden, and typically lower upfront costs.
On-premises BI runs on your own servers, giving you complete control over your data and infrastructure but requiring more internal resources to maintain.
For many mid-market to large enterprises, hybrid is not a preference but a practical reality. Organizations often have legacy on-premises systems they cannot fully replace, and their BI architecture must span both environments without sacrificing performance or governance consistency. A well-designed hybrid architecture acknowledges this reality rather than pretending you can rip and replace everything overnight.
This is where architectural engineers tend to live: architect once, scale everywhere. The BI architecture has to connect legacy and cloud systems, keep compatibility issues from turning into outages, and still deliver consistent metrics people can trust.
Traditional BI architectures process data in batches (daily, hourly, or at scheduled intervals). Real-time BI processes data as it arrives, enabling immediate insights and faster response to changing conditions.
Real-time architectures are particularly valuable for:
Real-time architectures are more complex to build and maintain. Not every use case requires sub-second data freshness. Sometimes yesterday's data is perfectly adequate for the decision at hand.
IT leaders often feel this tradeoff most directly: real-time pipelines at enterprise scale get tricky when the architecture relies on disconnected point solutions that need constant manual oversight.
Seeing how BI architecture works across different scenarios helps translate concepts into actionable patterns. The following examples show how organizations apply layered architecture with governance embedded throughout.
A retail company building an inventory optimization system might structure their architecture this way: point-of-sale data and warehouse management systems feed into an ELT pipeline that lands raw transactions in a Bronze layer. The Silver layer cleans and standardizes product codes across regions. The semantic layer defines "available inventory" consistently, accounting for in-transit stock and pending returns, so regional managers see the same numbers regardless of which dashboard they use. Row-level security ensures store managers only see their locations while regional directors see aggregated views. A single inventory metric that operations, finance, and merchandising all trust.
A financial services firm consolidating reporting across business units faces a different challenge. Data arrives from multiple trading platforms, each with different schemas and update frequencies. The architecture uses a lakehouse pattern to handle both structured trade data and unstructured research documents. The semantic layer defines certified metrics for profit and loss (P&L), risk exposure, and regulatory capital, with the finance team owning metric certification. RBAC controls ensure only authorized people access consolidated P&L data, with audit logging capturing every query for compliance purposes. When regulators ask how a number was calculated, lineage tracking traces it from the dashboard back through transformations to source systems.
A marketing analytics team at a consumer goods company needs to blend campaign performance data with sales outcomes. Their architecture ingests data from advertising platforms, CRM, and retail partners into a cloud warehouse. The semantic layer standardizes "customer acquisition cost" and "return on ad spend" calculations that previously varied across regional teams. Self-service BI tools let marketers explore data freely, but only certified metrics appear in executive dashboards. Freshness service-level agreements (SLAs) ensure campaign data refreshes within four hours, with alerts notifying the data team if pipelines miss their windows.
Before selecting tools or building infrastructure, you need to think through several critical design decisions.
Designing for growth sounds obvious. The challenge is maintaining architectural integrity as data volumes increase and new sources are added.
Scalability considerations include:
Beyond these fundamentals, performance architecture requires attention to non-functional requirements that competitors rarely address:
Measurable targets help teams align on expectations: dashboard load time under 3 seconds for executive views, daily refresh windows completing by 6 am, and support for 100+ people running reports during peak hours.
Most enterprise organizations are not building BI architecture from scratch. You're layering new capabilities onto existing systems, and the integration challenge is often the hardest part.
Key questions to address:
The integration cloud approach (using pre-built connectors and APIs to link disparate systems) has become the standard for organizations that need to move quickly without massive infrastructure overhauls.
If your tech stack is fragmented, compatibility matters as much as connectivity.
Technology is critical for business intelligence because it enables you to collect, store, and analyze data. The right technology will also allow you to share your insights with others in your organization.
ETL tools handle the critical work of moving data from sources to storage. Options range from traditional enterprise platforms to modern cloud-native solutions that can handle both batch and streaming data.
When evaluating ETL tools, consider:
Data engineers usually care less about flashy features and more about one thing: the pipeline runs, the data stays consistent, and nobody needs to babysit it.
Some platforms also emphasize broad connectivity (for example, connecting 1,000+ data sources) and built-in transformation options like Domo's Magic Transform, which supports both SQL-based and no-code approaches.
Business intelligence tools are software applications used to collect, store, and analyze data. These tools create reports, dashboards, and visualizations that help businesses understand their data.
Business intelligence tools help businesses make sense of their data. Without them, businesses face raw data that's difficult to interpret and act on.
Modern BI platforms combine visualization, analytics, and collaboration features in a single environment. When evaluating options, consider how well the platform supports both technical analysts and business people, and whether it can improve your customer relationships through better data access.
BI and IT managers also tend to ask a blunt question: "How many tools does this add to my stack?" Platforms that consolidate data exploration, metric definitions, and dashboards can reduce tool sprawl and make governance easier to enforce.
A well-designed BI architecture ensures that data systems and BI applications provide long-term value. It helps businesses understand their operations, optimize processes, track performance, and identify new revenue opportunities.
There are many benefits to having a business intelligence architecture, but three stand out:
Business intelligence can help businesses automate their reporting so that they can spend less time gathering data and more time analyzing it. Business intelligence can also help businesses automate their decision-making process so that they can make decisions more quickly.
For example, let's say that you are a retailer who needs to make decisions about what products to order for your store.
In the past, you might have had to spend days or even weeks gathering data about your sales, your competitor's sales, and trends in the industry. But with business intelligence, you can gather all of this data in one place and make decisions in a matter of minutes.
As BI matures, automation often extends past reporting. Many teams build workflows that push insights to the right channel, alert the right team, or kick off a follow-up process when the data hits a threshold.
Business intelligence can help businesses reduce their costs by helping them identify areas where they are wasting money. Business intelligence can also help businesses find new revenue streams and improve their margins.
A perfect example of this is a company that is able to use business intelligence to find new customers.
By using business intelligence, the company is able to target its marketing efforts and reach new customers that it would have otherwise never found.
Business intelligence can help businesses understand their customers and identify areas where they can improve their service. Business intelligence can also help businesses track customer satisfaction so that they can make changes to improve it.
For example, let's return to the eCommerce store mentioned earlier in this article.
By using business intelligence, the store can track how long it takes for customers to receive their orders. If the store notices that it is taking longer than usual for customers to receive their orders, it can make changes to its shipping process to improve customer satisfaction.
When data is fragmented across disconnected systems, you end up with inconsistent reporting that erodes trust in the analytics function. If executives can't trust the numbers, they won't use them to make decisions. And your BI investment loses its value.
Solutions include:
The goal is not just cleaner pipelines. It's building credibility so stakeholders actually rely on your data.
For IT and data leaders, this challenge often gets amplified by tool sprawl. The more disconnected BI and data tools you have, the harder it is to audit, enforce consistent definitions, and prove compliance.
Technical excellence means nothing if the organization does not adopt the tools you build. Buy-in challenges often stem from the need to demonstrate ROI and reposition the analytics function as a strategic driver rather than a cost center.
Strategies that work:
Even well-designed BI architectures fail when pipelines break silently. A dashboard showing yesterday's data at 10 am erodes trust faster than no dashboard at all. Data observability addresses how organizations detect and respond to pipeline failures before they affect people.
The core signals practitioners need to monitor include:
Practical solutions start with assigning data owners for each critical dataset, establishing clear freshness SLAs, and configuring pipeline circuit breakers that halt processing when quality checks fail rather than propagating bad data downstream. When a circuit breaker fires, a clear escalation path ensures the right team gets notified and can respond before people notice.
A simple observability checklist includes: pipeline run status monitoring, data volume trend tracking, query performance baselines, and dashboard load time alerts.
If you're thinking about implementing business intelligence in your organization, here's a practical approach structured around a phased blueprint:
This phased approach typically spans 12-16 weeks for an initial implementation, with ongoing iteration as needs change.
Before selecting tools or designing infrastructure, get clear on what you're trying to achieve. What decisions need better data? What questions can't you answer today? What would success look like in six months?
Aligning BI architecture with business objectives ensures you're building something that actually gets used, not just technically impressive infrastructure that sits idle.
Business intelligence is an ongoing process. It should be incorporated into your organization's day-to-day operations. In order to get the most out of business intelligence, you need to make sure that it is embedded into your organization's culture.
Start small, prove value, and expand. Each iteration should close the gap between data and decisions a little more.
Iterative development works best when connected to data operations (DataOps) principles: treating data pipelines with the same continuous integration and continuous delivery (CI/CD) rigor applied to software. Each iteration should include a review/test/deploy cycle for both pipeline code and semantic model changes. Version control, automated testing, and staged deployment prevent the "it worked in dev" surprises that erode trust.
Additional implementation principles to keep in mind:
If real-time reporting or AI-driven insights is part of your goal, treat that as an architecture requirement early. It's much easier than bolting it on after a year of disconnected point solutions. (You'll notice how many teams learn this the hard way.)
Business intelligence is a powerful tool that can help businesses make sound decisions, save money, and improve their customer service.
If you're thinking about implementing business intelligence in your organization, make sure you invest in a powerful business intelligence solution that fits your organization's specific needs.
When you build on the right architecture, business intelligence becomes more than a reporting tool. It becomes a foundation for competitive advantage. The key is having the right systems and processes in place so that you can move from fragmented data to a trusted, scalable analytics environment.
Organizations that get this right don't just generate reports more quickly. They transform their analytics function from a reactive service into a strategic driver that shapes how the business competes.
Ready to see what modern BI architecture looks like in practice? Get a demo to explore how Domo can help you build a data management foundation that scales with your business.
Domo transforms the way these companies manage business.


