Domo の自動データフローエンジンを使用すれば、ゲームの視聴者数を予測する際にかかる手動プロセスを数百時間短縮できました。
ビデオを見る

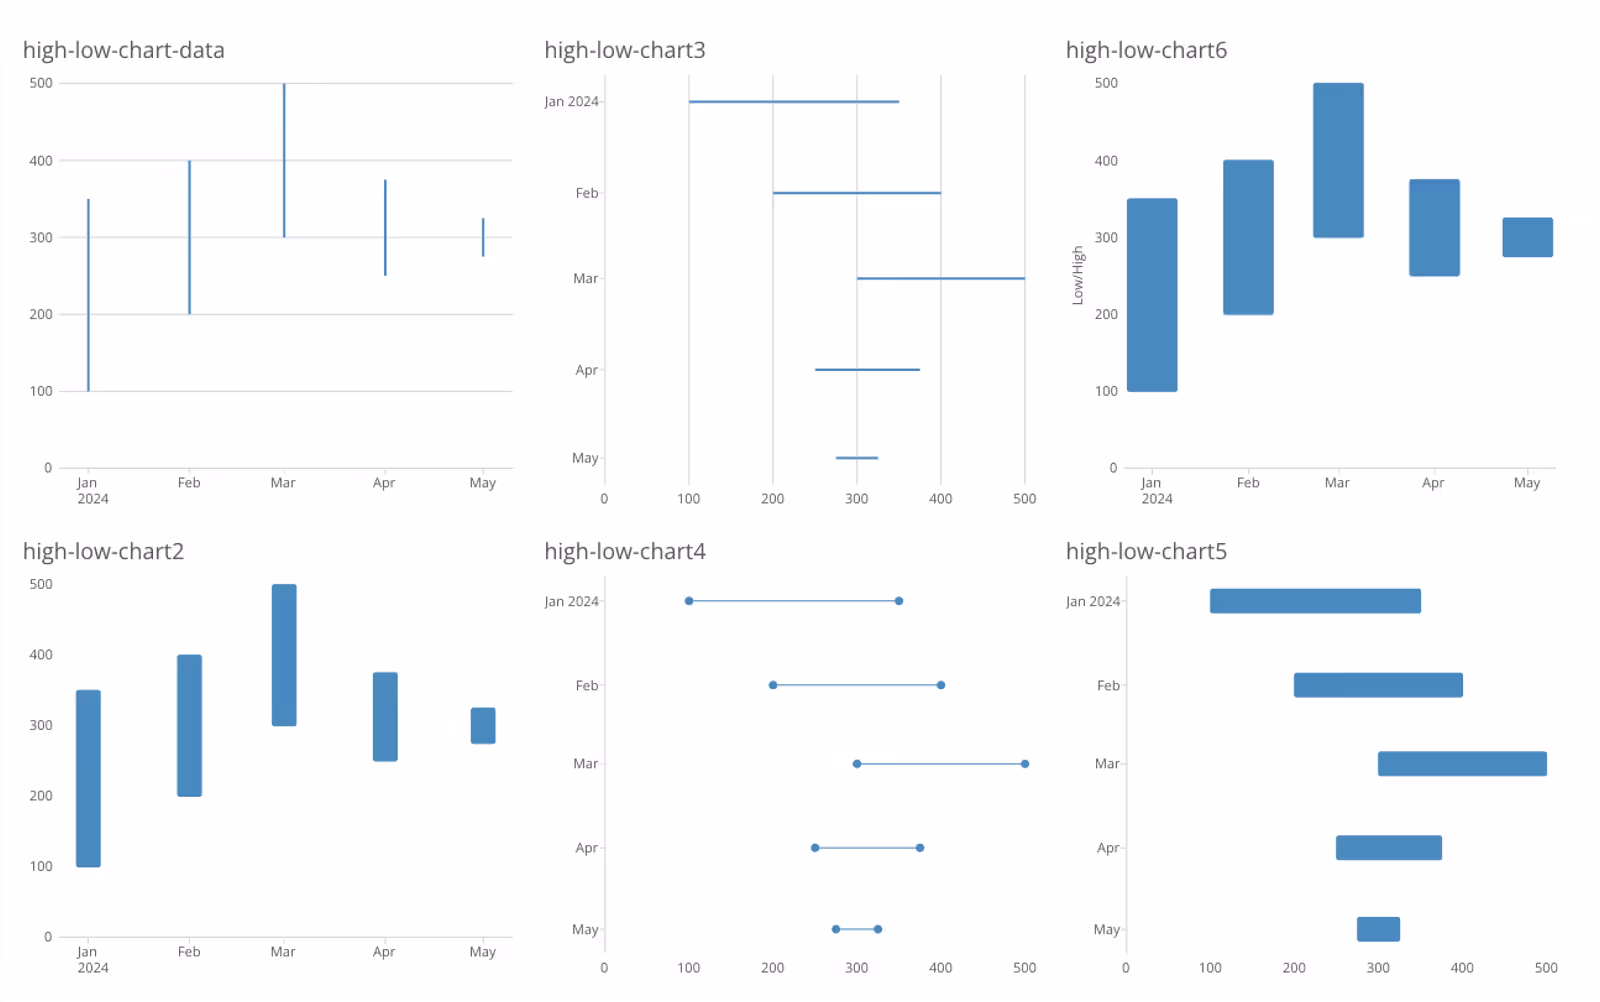
Before this release, if you tried to put extensive data into a high-low vertical bar chart, you would run out of space. Now, you can create Horizontal High-low Charts that better visualize a lot of data. The introduction of Domo’s Horizontal High-low Chart offers a horizontal orientation for displaying more content and accelerating insightful analysis of long item lists. This new feature also includes several customization options, such as line, bar, and lollipop visualization styles as well as color settings to ensure a consistent look and feel to other charts on a page or in an app.

Domo transforms the way these companies manage business.

.avif)


