Vous avez économisé des centaines d'heures de processus manuels lors de la prévision de l'audience d'un jeu à l'aide du moteur de flux de données automatisé de Domo.
Regardez la vidéo
With three new features to Domo’s charting capabilities, customers now have more options to enhance the visualizations of their data.
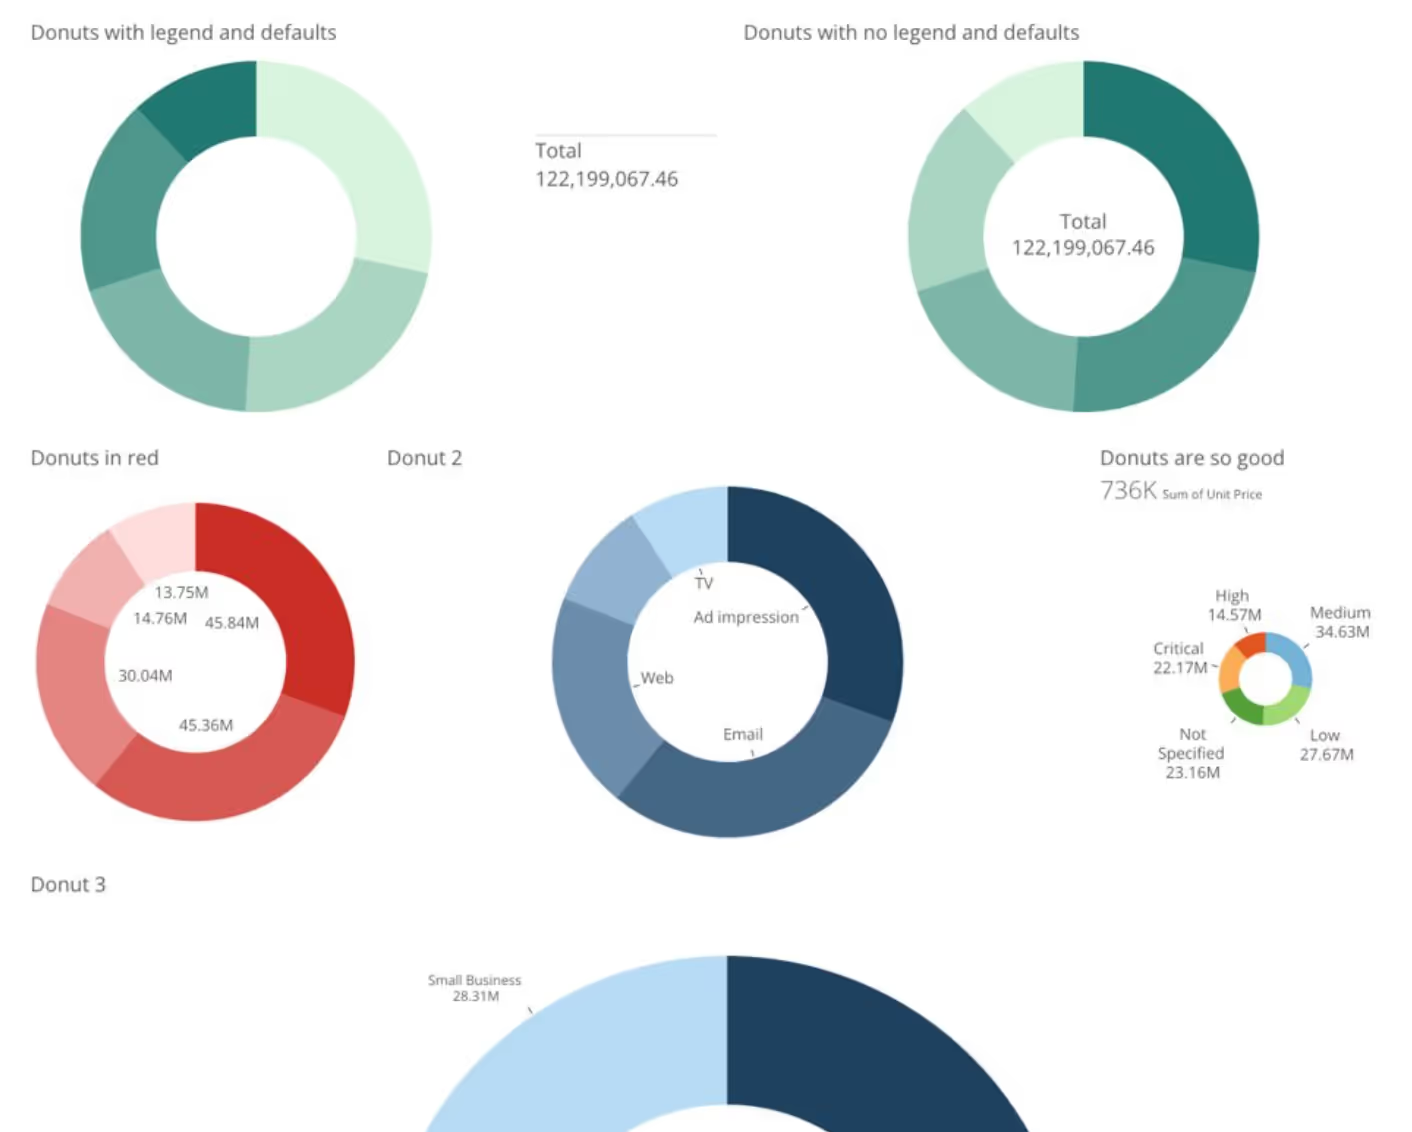
Donut charts now have data label and hover text options to increase interactive analysis. Data labels, when turned on, always appear for every element in a chart. This makes it easy for viewers to see information quickly. Hover text appear only when a viewer mouses over a chart element.
To turn on data labels, enter the desired data label text Data Label Settings > Text in Chart Properties.
Change the default hover text by specifying your own text in the Hover Text Settings > Text property in Chart Properties.
To include both data labels and customized hovers, specify both data label and hover text in Chart Properties.
Color and width options are now available for mega-table and pivot-table charting properties. These new customizations will increase readability in both Excel and App Studio. Use the new customizations in your mega-tables and pivot-tables inside of your Visualization card within Analyzer.
Previously, gauges only allowed customers to see current values versus a goal value. Now, customers can view between a certain range of values with visibility into values above a specific minimum and below a specific maximum, for example. Easily visualize values in the desired range.
The new enhancement is accessible in the chart type gauge inside of Analyzer.

Domo transforms the way these companies manage business.


.png)