Vous avez économisé des centaines d'heures de processus manuels lors de la prévision de l'audience d'un jeu à l'aide du moteur de flux de données automatisé de Domo.
Regardez la vidéo
Here at Domo, we love Halloween. We’re looking forward to holding our annual trick or treating event and Halloween costume contest at headquarters this year.
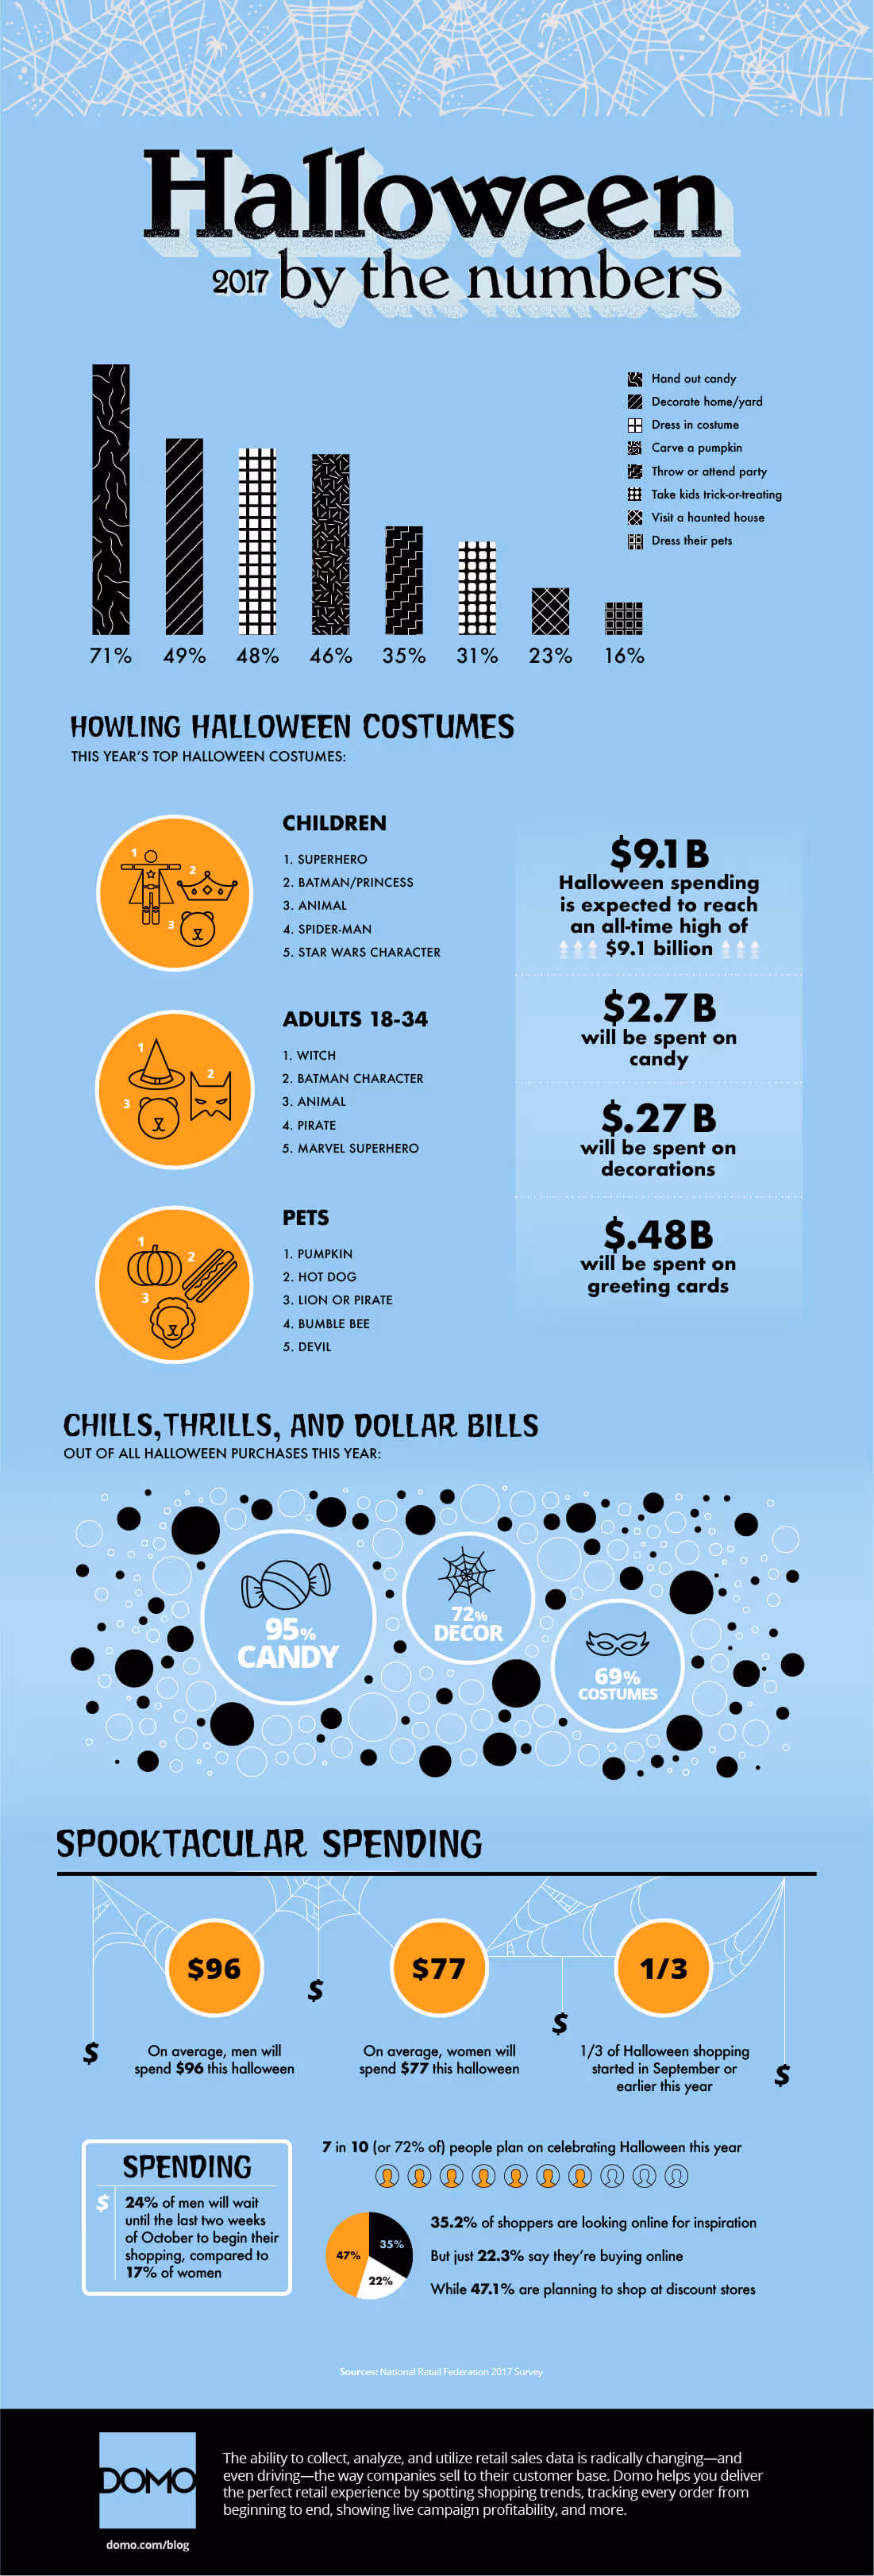
We also really dig data. That’s why we love featuring the wicked Halloween stats from the National Retail Federation—a tradition we started last year. This year, the NRF surveyed thousands of customers in September and found that 7 in 10 people plan on celebrating Halloween in 2017, more people than ever before. Halloween-related spending will also reach an all-time high of $9.1 billion, with $2.7 billion of that money spent on candy alone. The most popular costume for children follows last year’s trend—a superhero—while adults 18-34 will be most likely to go for a witch or a character from Batman. Popular pet costumes this year will be pumpkins, hot dogs, lions, and pirates, to name a few.
Check out more spooky stats below, and have a happy and safe Halloween from all of us here at Domo!
(Click below to enlarge the infographic)


.avif)


.png)